Concept explainers
Videos
(a)
To find:The slope of the uphill and downhill portion of the trip.
(a)
Answer to Problem 60HP
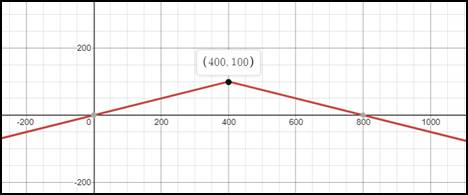
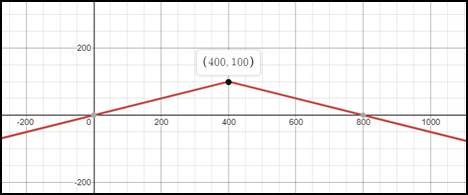
The slope of the uphill trip is ¼ and the slope of the downhill trip is -(1/4).
Explanation of Solution
Given:
The vertical cross-section of the hill is modelled by the equation
Calculation:
Plot the function of the hill.
For the range
Calculate the slope of the uphill of the trip:
Calculate the slope of the downhill trip:
Therefore, the slope of the uphill trip is ¼ and the slope of the downhill trip is (-1/4).
(b)
To plot:The graph of the function.
(b)
Answer to Problem 60HP
The graph of the function is drawn below.
Explanation of Solution
Given:
The vertical cross-section of the hill is modelled by the equation
Calculation:
In the given function, a vertical shift of 100 is observed from the equation. Since the function is negative, the graph of the function opens in the downward direction.
Plot the function of the hill.

Therefore, the graph of the function is drawn above.
(c)
To find:The domain and the range of the function of the hill.
(c)
Answer to Problem 60HP
The domain of the function is
Explanation of Solution
Given:
The vertical cross-section of the hill is modelled by the equation
Calculation:
Plot the function of the hill.
For the range
The set of input or argument values for which the function gives real and defined output is termed as the domain of the function. Find the domain from the given graph. In the given graph domain constraints and the undefined points are not observed. Therefore the domain of the graph is
The range is defined as the set of values of the dependent variables for which the function has defined values.
The range of the given function is
Therefore the domain of the graph is
Chapter 4 Solutions
Algebra 1
Additional Math Textbook Solutions
Basic Business Statistics, Student Value Edition
Calculus: Early Transcendentals (2nd Edition)
University Calculus: Early Transcendentals (4th Edition)
Introductory Statistics
Elementary Statistics (13th Edition)
Algebra and Trigonometry (6th Edition)


- I need help with number 5.arrow_forward3) Use the following system of linear inequalities graphed below to answer the questions. a) Use the graph to write the symbolic form of the system of linear inequalities. b) Is (-4,2) a solution to the system? Explain. 5 -7 -5 -3 -2 0 2 3 4 $ 6 -2 -6 -7arrow_forward) Graph the feasible region subject to the following constraints. x + y ≤ 6 y ≤ 2x x ≥ 0, y ≥ 0 P + xarrow_forward
- Solve the following system of equations: 50x+20y=1800 10x+3y=300arrow_forward> > > we are hiring Salesforce Admin Location: Remote Key Responsibilities: Administer Salesforce Sales & Revenue Cloud (CPQ & Billing) Configure workflows, validation rules & dashboards Automate processes using Flows & Process Builder Collaborate with Sales, Finance & Marketing teams Manage user roles & security Apply: Hr@forcecraver.comarrow_forwardAnswer this questionarrow_forward
- 1. vector projection. Assume, ER1001 and you know the following: ||||=4, 7=-0.5.7. For each of the following, explicitly compute the value. འབ (a) (b) (c) (d) answer. Explicitly compute ||y7||. Explain your answer. Explicitly compute the cosine similarity of and y. Explain your Explicitly compute (x, y). Explain your answer. Find the projection of onto y and the projection of onto .arrow_forward2. Answer the following questions using vectors u and v. --0-0-0 = find the the cosine similarity and the angle between u and v. འརྒྱ (a) (b) find the scalar projection of u onto v. (c) find the projection of u onto v. (d) (e) (f) find the scalar projection of onto u. find the projection of u onto u. find the projection of u onto and the projection of onto . (Hint: find the inner product and verify the orthogonality)arrow_forwardPlease type out answerarrow_forward
 Algebra and Trigonometry (6th Edition)AlgebraISBN:9780134463216Author:Robert F. BlitzerPublisher:PEARSON
 Contemporary Abstract AlgebraAlgebraISBN:9781305657960Author:Joseph GallianPublisher:Cengage Learning
 Linear Algebra: A Modern IntroductionAlgebraISBN:9781285463247Author:David PoolePublisher:Cengage Learning
 Algebra And Trigonometry (11th Edition)AlgebraISBN:9780135163078Author:Michael SullivanPublisher:PEARSON
 Introduction to Linear Algebra, Fifth EditionAlgebraISBN:9780980232776Author:Gilbert StrangPublisher:Wellesley-Cambridge Press
 College Algebra (Collegiate Math)AlgebraISBN:9780077836344Author:Julie Miller, Donna GerkenPublisher:McGraw-Hill Education