
Videos
To explain:The description of a step graph.
Answer to Problem 59HP
The description of a step graph is given below..
Explanation of Solution
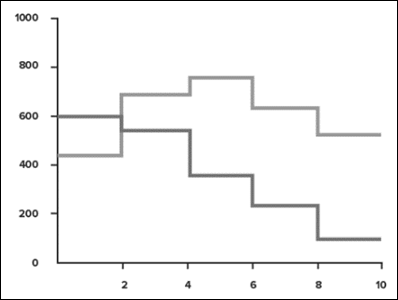
When a function is plotted, the graph obtained in the form of steps as a result of variation in the function values is termed as the step graph. The step graph is similar to the line graph but here the function values see a sudden change in the values resulting in forming of the steps on the graph.
The function output changes from one constant value to the other constant value depending on the input values. The changes in the one constant value to other constant value results in forming the steps on the graph.
The step graph is obtained as a result of
The example of piecewise function is shown in the figure:
Chapter 4 Solutions
Algebra 1
Additional Math Textbook Solutions
Using and Understanding Mathematics: A Quantitative Reasoning Approach (6th Edition)
Basic Business Statistics, Student Value Edition
Introductory Statistics
Algebra and Trigonometry (6th Edition)
Elementary Statistics: Picturing the World (7th Edition)


- I need help with number 5.arrow_forward3) Use the following system of linear inequalities graphed below to answer the questions. a) Use the graph to write the symbolic form of the system of linear inequalities. b) Is (-4,2) a solution to the system? Explain. 5 -7 -5 -3 -2 0 2 3 4 $ 6 -2 -6 -7arrow_forward) Graph the feasible region subject to the following constraints. x + y ≤ 6 y ≤ 2x x ≥ 0, y ≥ 0 P + xarrow_forward
- Solve the following system of equations: 50x+20y=1800 10x+3y=300arrow_forward> > > we are hiring Salesforce Admin Location: Remote Key Responsibilities: Administer Salesforce Sales & Revenue Cloud (CPQ & Billing) Configure workflows, validation rules & dashboards Automate processes using Flows & Process Builder Collaborate with Sales, Finance & Marketing teams Manage user roles & security Apply: Hr@forcecraver.comarrow_forwardAnswer this questionarrow_forward
- 1. vector projection. Assume, ER1001 and you know the following: ||||=4, 7=-0.5.7. For each of the following, explicitly compute the value. འབ (a) (b) (c) (d) answer. Explicitly compute ||y7||. Explain your answer. Explicitly compute the cosine similarity of and y. Explain your Explicitly compute (x, y). Explain your answer. Find the projection of onto y and the projection of onto .arrow_forward2. Answer the following questions using vectors u and v. --0-0-0 = find the the cosine similarity and the angle between u and v. འརྒྱ (a) (b) find the scalar projection of u onto v. (c) find the projection of u onto v. (d) (e) (f) find the scalar projection of onto u. find the projection of u onto u. find the projection of u onto and the projection of onto . (Hint: find the inner product and verify the orthogonality)arrow_forwardPlease type out answerarrow_forward
 Algebra and Trigonometry (6th Edition)AlgebraISBN:9780134463216Author:Robert F. BlitzerPublisher:PEARSON
 Contemporary Abstract AlgebraAlgebraISBN:9781305657960Author:Joseph GallianPublisher:Cengage Learning
 Linear Algebra: A Modern IntroductionAlgebraISBN:9781285463247Author:David PoolePublisher:Cengage Learning
 Algebra And Trigonometry (11th Edition)AlgebraISBN:9780135163078Author:Michael SullivanPublisher:PEARSON
 Introduction to Linear Algebra, Fifth EditionAlgebraISBN:9780980232776Author:Gilbert StrangPublisher:Wellesley-Cambridge Press
 College Algebra (Collegiate Math)AlgebraISBN:9780077836344Author:Julie Miller, Donna GerkenPublisher:McGraw-Hill Education