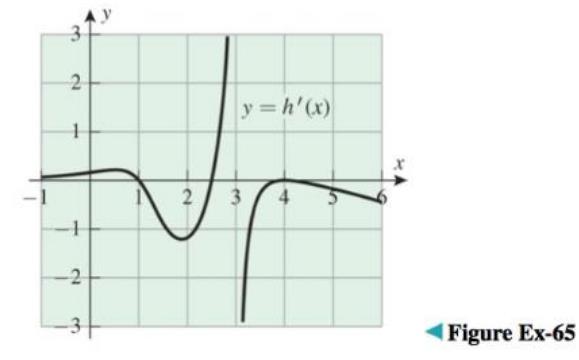
The accompanying figure shows the graph of the derivative of a function h that is defined and continuous on the interval − ∞ , + ∞ . Assume that the graph of h ′ has a vertical asymptote at x = 3 and that h ′ x → 0 + as x → − ∞ h ′ x → − ∞ as x → + ∞ (a) What are the critical points for h x ? (b) Identify the intervals on which h x is increasing. (c) Identify the x -coordinates of relative extrema for h x and classify each as a relative maximum or relative minimum. (d) Estimate the x -coordinates of inflection points for h x .
The accompanying figure shows the graph of the derivative of a function h that is defined and continuous on the interval − ∞ , + ∞ . Assume that the graph of h ′ has a vertical asymptote at x = 3 and that h ′ x → 0 + as x → − ∞ h ′ x → − ∞ as x → + ∞ (a) What are the critical points for h x ? (b) Identify the intervals on which h x is increasing. (c) Identify the x -coordinates of relative extrema for h x and classify each as a relative maximum or relative minimum. (d) Estimate the x -coordinates of inflection points for h x .
The accompanying figure shows the graph of the derivative of a function
h
that is defined and continuous on the interval
−
∞
,
+
∞
. Assume that the graph of
h
′
has a vertical asymptote at
x
=
3
and that
h
′
x
→
0
+
as
x
→
−
∞
h
′
x
→
−
∞
as
x
→
+
∞
(a) What are the critical points for
h
x
?
(b) Identify the intervals on which
h
x
is increasing.
(c) Identify the x-coordinates of relative extrema for
h
x
and classify each as a relative maximum or relative minimum.
(d) Estimate the x-coordinates of inflection points for
h
x
.
Formula Formula A function f(x) attains a local maximum at x=a , if there exists a neighborhood (a−δ,a+δ) of a such that, f(x)<f(a), ∀ x∈(a−δ,a+δ),x≠a f(x)−f(a)<0, ∀ x∈(a−δ,a+δ),x≠a In such case, f(a) attains a local maximum value f(x) at x=a .
2. [-/4 Points]
DETAILS
MY NOTES
SESSCALCET2 7.3.002.
Let S be the solid obtained by rotating the region shown in the figure about the y-axis. (Assume a = 6 and b = 2.)
ASK YOUR TEACHER
0
y = a sin(bx²)
Sketch a typical approximating shell.
y
6
4
2
x
π/b
y
2
1
x
0.5
1.0
1.5
0.2
0.4
0.6
0.8
1.0
-2
-1
-4
The graph of f', the derivative of f, is shown in the graph below. If f(-9) = -5, what is the value of f(-1)?
y
87 19
6
LO
5
4
3
1
Graph of f'
x
-10 -9 -8 -7 -6 -5 -4 -3 -2 -1
1
2
3
4 5
6
7 8 9 10
-1
-2
-3
-4
-5
-6
-7
-8
564%
Let f(x)=−7e^xsinxf'(x)=
Chapter 4 Solutions
Calculus Early Transcendentals, Binder Ready Version
Need a deep-dive on the concept behind this application? Look no further. Learn more about this topic, calculus and related others by exploring similar questions and additional content below.


 College Algebra (MindTap Course List)AlgebraISBN:9781305652231Author:R. David Gustafson, Jeff HughesPublisher:Cengage Learning
 Trigonometry (MindTap Course List)TrigonometryISBN:9781337278461Author:Ron LarsonPublisher:Cengage Learning
 College AlgebraAlgebraISBN:9781305115545Author:James Stewart, Lothar Redlin, Saleem WatsonPublisher:Cengage Learning
 Algebra & Trigonometry with Analytic GeometryAlgebraISBN:9781133382119Author:SwokowskiPublisher:Cengage