Videos
This phenomenon is so common, in fact, that data sets that follow a similar pattern are said to be
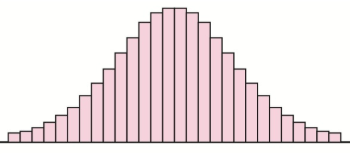
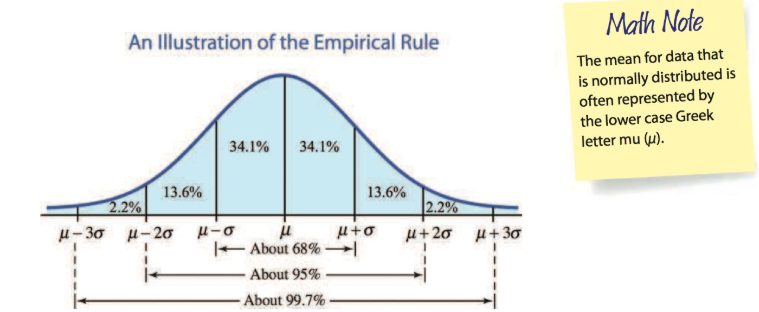
I only collected 100 pods, out of thousands (maybe millions) on the tree. If I had collected a lot more of them, the picture would most likely have started to look a lot like the nice, symmetric diagram to the right. When a group of data is normally distributed, and we know the mean and standard deviation, there’s a rule that allows us to estimate how many data values fall within certain ranges. This is known as the empirical rule, and it’s illustrated by the diagram below.
The empirical rule says that when a data set is normally distributed, about 68% of all values will fall within one standard deviation of the mean; about 95% will fall within 2 standard deviations of the mean; and about 99.7% will fall within 3 standard deviations of the mean.
For example, the heights of American men are normally distributed with mean 5 feet 9.3 inches and standard deviation 2.8 inches. That is,
is 5 feet 9.3 inches, and
Use the information just given about
Want to see the full answer?
Check out a sample textbook solution
Chapter 4 Solutions
Pathways to Math Literacy (Loose Leaf)


- x The function of is shown below. If I is the function defined by g(x) = [* f(t)dt, write the equation of the line tangent to the graph of 9 at x = -3. g y Graph of f 8 7 6 5 4 32 1 x -10 -9 -8 -7 -6 -5 -4 -3 -2 -1 1 2 3 4 5 6 7 8 9 10 -1 -2 -3 56 -6 -7 -8arrow_forward- Problem 3: For a short time, the 300-kg roller-coaster car with passengers is traveling along the spiral track at a constant speed of v = 8 m/s with r = 15 m. If the track descends d = 6 m for every full revolution, 0 = 2π rad, determine the magnitudes of the components of force which the track exerts on the car in the r, 0, and z directions. Neglect the size of the car. Bonus: Develop a MATLAB program to solve for this problem.arrow_forwardLet f(x)=4excosxf'(x)=arrow_forward
- The graph of the function f in the figure below consists of line segments and a quarter of a circle. Let g be the function given by x g(x) = __ f (t)dt. Determine all values of a, if any, where g has a point of inflection on the open interval (-9, 9). 8 y 7 76 LO 5 4 3 2 1 -10 -9 -8 -7 -6 -5 -4 -3 -2 -1 1 2 3 ♡. -1 -2 3 -4 56 -5 -6 -7 -8 Graph of f 4 5 16 7 8 9 10arrow_forwardpls helparrow_forwardThe areas of the regions bounded by the graph of the function f and the x-axis are labeled in the figure below. Let the function g be C defined by the equation g(x) = [* f(t)dt. What is the maximum value of the function g on the closed interval [-7, 8]? 17 y Graph of f 00 8 76 5 4 3 2 1 -10 -9 -8 -7 -6 -5 -4 -3-2-1 -2 702 4 1 21 3 4 568 -4 -5 --6 -7 -8 x 5 6 7 8 9 10 17arrow_forward
- No chatgpt pls will upvote Already got wrong chatgpt answerarrow_forwardpls helparrow_forwardA tank holds a 135 gal solution of water and salt. Initially, the solution contains 21 lb of salt. A salt solution with a concentration of 3 lb of salt per gal begins flowing into the tank at the rate of 3 gal per minute. The solution in the tank also begins flowing out at a rate of 3 gal per minute. Let y be the amount of salt present in the tank at time t. (a) Find an expression for the amount of salt in the tank at any time. (b) How much salt is present after 51 minutes? (c) As time increases, what happens to the salt concentration?arrow_forward
 Big Ideas Math A Bridge To Success Algebra 1: Stu...AlgebraISBN:9781680331141Author:HOUGHTON MIFFLIN HARCOURTPublisher:Houghton Mifflin Harcourt
 Holt Mcdougal Larson Pre-algebra: Student Edition...AlgebraISBN:9780547587776Author:HOLT MCDOUGALPublisher:HOLT MCDOUGAL
 Glencoe Algebra 1, Student Edition, 9780079039897...AlgebraISBN:9780079039897Author:CarterPublisher:McGraw Hill
 Linear Algebra: A Modern IntroductionAlgebraISBN:9781285463247Author:David PoolePublisher:Cengage Learning