
The Carbondale Hospital is considering the purchase of a new ambulance. The decision will rest partly on the anticipated mileage to be driven next year. The miles driven during the past 5 years are as follows:
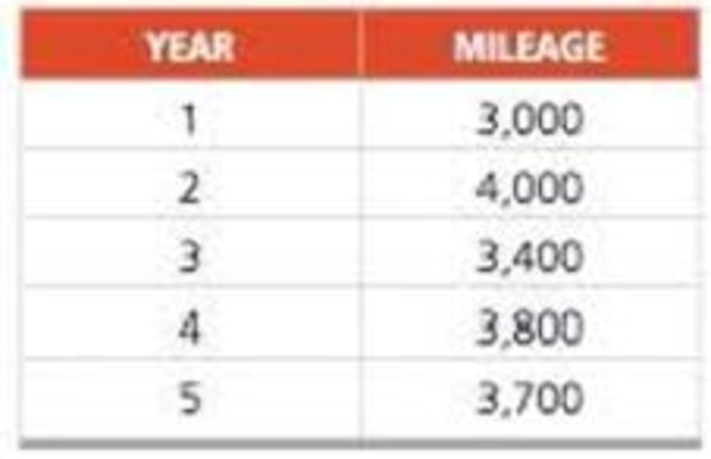
a) Forecast the mileage for next year (6th year) using a 2-year moving average.
b) Find the MAD based on the 2-year moving average. (Hint: You will have only 3 years of matched data.)
c) Use a weighted 2-year moving average with weights of .4 and .6 to forecast next year’s mileage. (The weight of .6 is for the most recent year.) What MAD results from using this approach to
d) Compute the forecast for year 6 using exponential smoothing, an initial forecast for year 1 of 3,000 miles, and α = .5.
a)
To determine: Using 2-year moving average, forecast the mileage for the 6th year.
Introduction: Forecasting is used to predict future changes or demand patterns. It involves different approaches and varies with different time periods. A sequence of data points in successive order is known as a time series. Time series forecasting is the prediction based on past events which are at a uniform time interval.
Answer to Problem 5P
The forecasted mileage for the 6th year is 3,750.
Explanation of Solution
Given information:
| Year | Mileage |
| 1 | 3,000 |
| 2 | 4,000 |
| 3 | 3,400 |
| 4 | 3,800 |
| 5 | 3,700 |
Formula to forecast the mileage for the 6th year:
| Year | Mileage | Moving Average |
| 1 | 3,000 | |
| 2 | 4,000 | |
| 3 | 3,400 | 3,500 |
| 4 | 3,800 | 3,700 |
| 5 | 3,700 | 3,600 |
| 6 | 3,750 |
Excel worksheet:
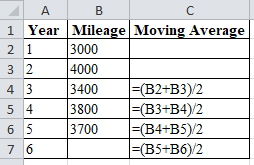
Calculation of the mileage forecast for the 6th year:
The mileage forecast for the 6th year is obtained by summing up the mileage for the 4th and 5thyears and dividing the sum by the
The forecast for the 6th year is 3,750.
Hence, using 2-year moving average, the mileage forecast for the 6th year is 3,750
b)
To determine: The computation of the Mean Average Deviation (MAD) using 2-year moving average.
Answer to Problem 5P
Mean Average Deviation (MAD) using 2-year moving average is 100
Explanation of Solution
Given information:
| Year | Mileage |
| 1 | 3,000 |
| 2 | 4,000 |
| 3 | 3,400 |
| 4 | 3,800 |
| 5 | 3,700 |
Formula to compute MAD:
| Year | Mileage | Moving Average | Error | Absolute Error |
| 1 | 3,000 | |||
| 2 | 4,000 | |||
| 3 | 3,400 | 3,500 | -100 | 100 |
| 4 | 3,800 | 3,700 | 100 | 100 |
| 5 | 3,700 | 3,600 | 100 | 100 |
| Total | 300 | |||
| MAD | 100 |
Excel worksheet:
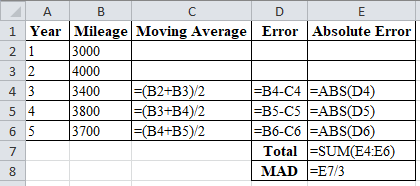
Calculation of the absolute error for year 3:
Moving average:
Error:
Absolute error:
To calculate the forecast for year 3, divide the summation of the values of year 1&2 by period n i.e. 2. The corresponding value is 3500 which is the forecast for the year 3.
Absolute Error for year 3 is the modulus of the difference between 3400 and 3500, which corresponds to 100. Therefore absolute error for year 3 is 100.
Calculation of the absolute error for year 4:
Moving average:
Error:
Absolute error:
To calculate the forecast for year 4, divide the summation of the values of year 2&3 by period n i.e. 2. The corresponding value is 3700 which is the forecast for the year 4.
Absolute Error for year 4 is the modulus of the difference between 3800 & 3700 which corresponds to 100. Therefore Absolute error for Year 4 is 100.
Calculation of the absolute error for year 5:
Moving average:
Error:
Absolute error:
To calculate the forecast for year 5, divide the summation of the values of year 3&4 by period n i.e. 2. The corresponding value is 3600 which is the forecast for the year 5.
Absolute Error for year 5 is the modulus of the difference between 3,700 & 3,600 which corresponds to 100. Therefore Absolute error for Year 5 is 100.
Calculation of the Mean Absolute Deviation:
Mean Absolute Deviation is obtained by dividing the summation of absolute values by the number of years. Absolute error is obtained by taking modulus for the difference between Actual and forecasted values.
Upon substitution of summation value of absolute error for 3 years i.e. 300 is divided by number of years i.e. 3 yields MAD of 100.
Hence, the computed Mean Average Deviation (MAD) using 2-year moving average is 100
c)
To determine: The mileage forecast for year 6 and also compute Mean Absolute Deviation (MAD) using weighted 2-year moving average with weights 0.4 and 0.6
Answer to Problem 5P
The forecast for year 6 and the Mean Absolute Deviation (MAD) using weighted moving averages are 3,741 & 139.67 respectively.
Explanation of Solution
Given information:
| Year | Mileage |
| 1 | 3,000 |
| 2 | 4,000 |
| 3 | 3,400 |
| 4 | 3,800 |
| 5 | 3,700 |
Formula to compute MAD:
| Year | Mileage | Weighted Moving Average | Error | Absolute Error |
| 1 | 3,000 | |||
| 2 | 4,000 | |||
| 3 | 3,400 | 3,601 | -201 | 201 |
| 4 | 3,800 | 3,641 | 159 | 159 |
| 5 | 3,700 | 3,641 | 59 | 59 |
| 6 | 3,741 | |||
| Total | 419 | |||
| MAD | 139.67 |
Excel worksheet:
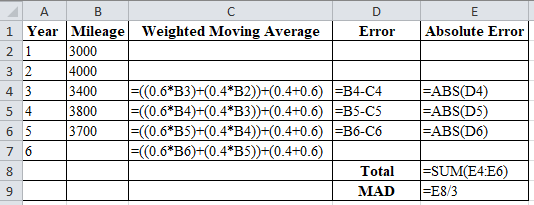
Calculation of the weighted moving average for year 3:
To calculate the forecast for year 3, multiply the weights with the mileage of recent year, i.e. multiply weight 0.6 with 4,000 and 0.4 with 3,000. Divide the summation of the multiplied values with the summation of the weights i.e. (0.6+0.4).
The corresponding result is 3,601 obtained is the forecasted value for year 3. Therefore, forecasted Weighted Moving Average for year 3 is 3,601.
Calculation of the weighted moving average for year 4:
To calculate the forecast for year 4, multiply the weights with the mileage of recent year, i.e. multiply weight 0.6 with 3,400 and 0.4 with 4,000. Divide the summation of the multiplied values with the summation of the weights i.e. (0.6+0.4).
The corresponding result is 3641 obtained is the forecasted value for year 4. Therefore, forecasted Weighted Moving Average for year 3 is 3,641.
Calculation of the weighted moving average for year 5:
To calculate the forecast for year 5, multiply the weights with the mileage of recent year, i.e. multiply weight 0.6 with 3,800 and 0.4 with 3,400. Divide the summation of the multiplied values with the summation of the weights i.e. (0.6+0.4).
The corresponding result is 3641 obtained is the forecasted value for year 5. Therefore, forecasted Weighted Moving Average for year 3 is 3,641.
Calculation of the weighted moving average for year 6:
To calculate the forecast for year 6, multiply the weights with the mileage of recent year, i.e. multiply weight 0.6 with 3,700 and 0.4 with 3,800. Divide the summation of the multiplied values with the summation of the weights i.e.
The corresponding result is 3,741 obtained is the forecasted value for year 6. Therefore, forecasted Weighted Moving Average for year 6 is 3,741.
Absolute Error:
Absolute error is the modulus of the difference between the values of actual and forecasted demand.
Calculation of the absolute error for year 3:
Absolute Error for year 3 is the modulus of the difference between 3400 and 3601, which corresponds to 201. Therefore absolute error for year 3is 201;
Calculation of the absolute error for year 4:
Absolute Error for year 4 is the modulus of the difference between 3800 and 3641, which corresponds to 159. The absolute error for year 4 is 159.
Calculation of the absolute error for year 5:
Absolute Error for year 5 is the modulus of the difference between 3,700 and 3,641, which corresponds to 59. The absolute error for year 5 is 59.
Calculation of the Mean Absolute Deviation:
Upon substitution of summation value of absolute error for 13 years i.e. 419 is divided by number of years i.e. 3 yields MAD of 139.67. Therefore, Mean Absolute Deviation =139.67
Hence, using weighted 2-year moving average with weights 0.4 and 0.6, the mileage forecast for year 6 and the computed Mean Absolute Deviation (MAD)are 3,741and 139.67,respectively.
d)
To determine: Using exponential smoothing technique, forecast the mileage for year 6.
Answer to Problem 5P
The mileage forecast for year 6 is 3,662.5
Explanation of Solution
Given information:
| Year | Mileage |
| 1 | 3,000 |
| 2 | 4,000 |
| 3 | 3,400 |
| 4 | 3,800 |
| 5 | 3,700 |
Formula to calculate the demand forecast:
Where,
| Year | Mileage | Forecast |
| 1 | 3,000 | 3,000 |
| 2 | 4,000 | 3,000 |
| 3 | 3,400 | 3,500 |
| 4 | 3,800 | 3,450 |
| 5 | 3,700 | 3,625 |
| 6 | 3,662.5 |
Excel worksheet:
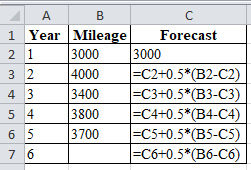
Calculation of the forecast for year 2:
To calculate forecast for the year 2, substitute the value of forecast of year 1, smoothing constant and difference of actual and forecasted mileage in the above formula. The result of forecast for year 2 is 3,000.
Calculation of the forecast for year 3:
To calculate forecast for the year 3, substitute the value of forecast of year 2, smoothing constant and difference of actual and forecasted mileage in the above formula. The result of forecast for year 3 is 3500.
Calculation of the forecast for year 4:
To calculate forecast for the year 4, substitute the value of forecast of year 3, smoothing constant and difference of actual and forecasted mileage in the above formula. The result of forecast for year 2 is 3,450.
Calculation of the forecast for year 5:
To calculate forecast for the year 5, substitute the value of forecast of year 4, smoothing constant and difference of actual and forecasted mileage in the above formula. The result of forecast for year 5 is 3,625.
Calculation of the forecast for year 6:
To calculate forecast for the year 6, substitute the value of forecast of year 5, smoothing constant and difference of actual and forecasted mileage in the above formula. The result of forecast for year 6 is 3,662.5.
Hence, using exponential smoothing technique, the forecast for year 6 is 3,662.5.
Want to see more full solutions like this?
Chapter 4 Solutions
Pearson eText Principles of Operations Management: Sustainability and Supply Chain Management -- Instant Access (Pearson+)
- IM.82 A distributor of industrial equipment purchases specialized compressors for use in air conditioners. The regular price is $50, however, the manufacturer of this compressor offers quantity discounts per the following discount schedule: Option Plan Quantity Discount A 1 - 299 0% B 300 - 1,199 0.50% C 1,200+ 1.50% The distributor pays $56 each time it places an order with the manufacturer. Holding costs are negligible (none) but they do earn 10% annual interest on all cash balances (meaning there will be a financial opportunity cost when they put cash into inventory). Annual demand is expected to be 10,750 units. When there is no quantity discount (Option Plan A, the first row of the schedule listed above), what is the adjusted order quantity? (Display your answer to the nearest whole number.) 491 Based on your answer to the previous question, and based on the annual demand as stated above, what will be the annual ordering costs? (Display your answer to the…arrow_forwardExcel Please. The workload of many areas of banking operations varies considerably based on time of day. A variable capacity can be achieved effectively by employing part-time personnel. Because part-timers are not entitled to all the fringe benefits, they are often more economical than full-time employees. Other considerations, however, may limit the extent to which part-time people can be hired in a given department. The problem is to find an optimal workforce schedule that would meet personnel requirements at any given time and also be economical. Some of the factors affecting personnel assignments are listed here: The bank is open from 9:00am to 7:00pm. Full-time employees work for 8 hours (1 hour for lunch included) per day. They do not necessarily have to start their shift when the bank opens. Part-time employees work for at least 4 hours per day, but less than 8 hours per day and do not get a lunch break. By corporate policy, total part-time personnel hours is limited…arrow_forwardIM.84 An outdoor equipment manufacturer sells a rugged water bottle to complement its product line. They sell this item to a variety of sporting goods stores and other retailers. The manufacturer offers quantity discounts per the following discount schedule: Option Plan Quantity Price A 1 - 2,399 $5.50 B 2,400 - 3,999 $5.20 C 4,000+ $4.50 A large big-box retailer expects to sell 9,700 units this year. This retailer estimates that it incurs an internal administrative cost of $225 each time it places an order with the manufacturer. Holding cost for the retailer is $55 per case per year. (There are 40 units or water bottles per case.) Based on this information, and not taking into account any quantity discount offers, what is the calculated EOQ (in units)? (Display your answer to the nearest whole number.) Number Based on this information, sort each quantity discount plan from left to right by dragging the MOST preferred option plan to the left, and the LEAST preferred…arrow_forward
- In less than 150 words, what is an example of what your reflection of core values means to you and your work: Commitment, Perseverance, Community, Service, Pride?arrow_forwardPrepare a report on the following: Part 1: Discuss the role of the corporate secretary in facilitating effective governance in a limited liability company. Include the relationships with directors, shareholders, and other officers. Part 2: Compare and contrast two characteristics of different business entities (sole trader, partnership, and limited liability company). Use examples to recommend the most appropriate type of business entity for the scenario below: Scenario Background Alex, Taylor, and Jordan plan to collaborate to launch a tech startup focused on developing and selling innovative software solutions. Each individual brings unique skills and resources to the venture: Alex: A skilled software developer with technical expertise and a vision for the product. Taylor: A marketing professional with extensive connections in the technology industry, aiming to drive sales and build the brand. Jordan: An investor willing to contribute significant financial resources but…arrow_forwardProblem 1 (20 Points) Davison Electronics manufactures three LED television monitors, identified as Model A, Model B, and Model C. Davison Electronics four manufacturing plants. Each model has its lowest possible production cost when produced at Plant 1. However, Plant 1 does not have the capacity to handle the total production of all three models. As a result, at least some of the production must be routed to the other manufacturing plants. The following table shows the minimum production requirements for next month, the plant capacities in units per month, and the production cost per unit at each plant: Model Production Cost per Unit Minimum Production Requirements Plant 1 Plant 2 Plant 3 Plant 4 A $25 $28 $37 $34 48,000 B $26 $35 $36 $41 75,000 C $20 $31 $26 $23 60,000 Production Capacity 65,000 50,000 32,000 43,000 Davison’s objective is to determine the cost-minimizing production plan. Without…arrow_forward
- SECTION B: TOPIC STRUCTURE CAPSTONE PROJECT TOPIC SUBMISSION TEMPLATE SECTION A: STUDENT DETAILS Student number Title (Mr/Miss/Ms/Mrs) Surname First name/s Title of research Date and year of registration Work Home Contact details Cell Region Date submitted Email 1.1 Title Insert title of the research. Choose a title that captures the essence of your proposed project. 1.2 Background to the Problem This section will be used to create the readers' interest. It can include a specific description of the topic that is to be investigated. A brief preview of the topic and the foundation of the problem should also be given. The researcher can achieve this through building up a detailed background of circumstances that lead to the problem being examined. Therefore, the background helps the reader understand the specific problem addressed by the researcher. This section should not include the background/history of the organisation. The background to the problem should not be more than ½ a page.…arrow_forwardDoes Nike Corporation's emphasis on lean operations help the Vietnamese workforce that still earns $150.00 minimum wage a month since 2014?arrow_forwardInformation Security Innovation within a Contemporary Business Environment All organisations using computers need to consider the security of information they keep. Many organisations utilise Websites for their core business functions and this results in monetary transactions being carried out on the Websites.arrow_forward
- Please help with a complete research report on the topic below: "Information Security Innovation within a Contemporary Business Environment " The format of the report should follow this below.arrow_forward7. Wireless Infrastructure in the Cloud Wireless devices have changed the way organisations and their customers interact. Wireless enabled devices have driven the mindset that wireless networks must be ubiquitous, fast, and constantly available. These are demands that have traditionally put organisations and their user communities in direct conflict with their IT departments, as constructing and maintaining wireless infrastructures are typically time-consuming, complex, and costly endeavours.arrow_forwardIM.54 A growing online retailer sells thousands of items yet has has one specialty product category with just 30 items. They want to classify these thirty items according to the annual dollar volume (revenue) generated by each item. The table below lists each item number, Annual Sales (in units), and Price per unit: Item # Annual Sales Price 1 221 $25.85 2 446 $14.15 3 8,940 $168.19 4 2,965 $15.99 5 1,322 $29.37 6 2,575 $12.77 7 767 $28.43 8 5,803 $163.01 9 2,673 $20.51 10 642 $14.71 11 4,168 $54.53 12 1,881 $22.55 13 2,417 $29.63 14 5,207 $36.41 15 1,381 $20.55 16 9,635 $173.69 17 17,406 $27.07 18 1,573 $25.99 19 6,471 $64.99 20 6,047 $29.83 21 433 $20.89 22 2,279 $53.59 23 15,532 $106.91 24 1,585 $4.09 25 5,376 $65.23 26 2,965 $37.93 27 2,048 $28.51 28 1,174 $22.99 29 381 $5.57 30 2,930 $3.43 Which item in the table above has the highest annual dollar volume? In the answer field below, write the ITEM # that…arrow_forward
- MarketingMarketingISBN:9780357033791Author:Pride, William MPublisher:South Western Educational Publishing
 Practical Management ScienceOperations ManagementISBN:9781337406659Author:WINSTON, Wayne L.Publisher:Cengage,
 Contemporary MarketingMarketingISBN:9780357033777Author:Louis E. Boone, David L. KurtzPublisher:Cengage Learning
  Purchasing and Supply Chain ManagementOperations ManagementISBN:9781285869681Author:Robert M. Monczka, Robert B. Handfield, Larry C. Giunipero, James L. PattersonPublisher:Cengage Learning


