Concept explainers
(a)
Interpretation:
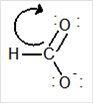
Draw the contributing structure of.
Concept Introduction:
Lewis electron dot symbol is a structure of a molecule that shows the bonding between atoms as well as lone pairs of electrons of atoms also.
Valence electron: The electrons which are present in the outer most energy level are known as valence electron. This can be calculated by the group number of the element. Generally the group number is same as the valence electrons of any elements.
(b)
Interpretation:
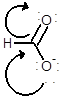
Draw the contributing structure of.
Concept Introduction:
Lewis electron dot symbol is a structure of a molecule that shows the bonding between atoms as well as lone pairs of electrons of atoms also.
Valence electron: The electrons which are present in the outer most energy level are known as valence electron. This can be calculated by the group number of the element. Generally the group number is same as the valence electrons of any elements.
(c)
Interpretation:
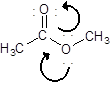
Draw the contributing structure of.
Concept Introduction:
Lewis electron dot symbol is a structure of a molecule that shows the bonding between atoms as well as lone pairs of electrons of atoms also.
Valence electron: The electrons which are present in the outer most energy level are known as valence electron. This can be calculated by the group number of the element. Generally the group number is same as the valence electrons of any elements.

Trending nowThis is a popular solution!

Chapter 3 Solutions
Student Solutions Manual for Bettelheim/Brown/Campbell/Farrell/Torres' Introduction to General, Organic and Biochemistry, 11th


- What is the final product when D-galactose reacts with hydroxylamine?arrow_forwardIndicate the formula of the product obtained by reacting methyl 5-chloro-5-oxopentanoate with 1 mole of 4-penten-1-ylmagnesium bromide.arrow_forwardIn the two chair conformations of glucose, the most stable is the one with all the OH groups in the equatorial position. Is this correct?arrow_forward
- please help me with my homeworkarrow_forwardhelparrow_forwardThe temperature on a sample of pure X held at 1.25 atm and -54. °C is increased until the sample boils. The temperature is then held constant and the pressure is decreased by 0.42 atm. On the phase diagram below draw a path that shows this set of changes. pressure (atm) 2 0 0 200 400 temperature (K) Xarrow_forward
- QUESTION: Answer Question 5: 'Calculating standard error of regression' STEP 1 by filling in all the empty green boxes *The values are all provided in the photo attached*arrow_forwardpressure (atm) 3 The pressure on a sample of pure X held at 47. °C and 0.88 atm is increased until the sample condenses. The pressure is then held constant and the temperature is decreased by 82. °C. On the phase diagram below draw a path that shows this set of changes. 0 0 200 temperature (K) 400 аarrow_forwarder your payment details | bar xb Home | bartleby x + aleksogi/x/isl.exe/1o u-lgNskr7j8P3jH-1Qs_pBanHhviTCeeBZbufuBYT0Hz7m7D3ZcW81NC1d8Kzb4srFik1OUFhKMUXzhGpw7k1 O States of Matter Sketching a described thermodynamic change on a phase diagram 0/5 The pressure on a sample of pure X held at 47. °C and 0.88 atm is increased until the sample condenses. The pressure is then held constant and the temperature is decreased by 82. °C. On the phase diagram below draw a path that shows this set of changes. pressure (atm) 1 3- 0- 0 200 Explanation Check temperature (K) 400 X Q Search L G 2025 McGraw Hill LLC. All Rights Reserved Terms of Use Privacy Cearrow_forward
 Introduction to General, Organic and BiochemistryChemistryISBN:9781285869759Author:Frederick A. Bettelheim, William H. Brown, Mary K. Campbell, Shawn O. Farrell, Omar TorresPublisher:Cengage Learning
 World of Chemistry, 3rd editionChemistryISBN:9781133109655Author:Steven S. Zumdahl, Susan L. Zumdahl, Donald J. DeCostePublisher:Brooks / Cole / Cengage Learning