Videos
To calculate: The coordinates of the vertices of the feasible region formed by graphing the given inequalities
Answer to Problem 17PPS
The graph of the given system of inequalities is,

The coordinates of the feasible region are
The maximum value of the function is
Explanation of Solution
Given information:
The inequalities
Formula used:
Linear programming is a technique to find the maximum and the minimum value of a given function over a given system of some inequalities, with each inequality representing a constraint. Graph the inequalities and obtain the vertices of the feasible region (solution set). Substitute the coordinates of the feasible region in the function and determine the maximum and the minimum value.
Calculation:
Consider the provided system of inequalities
Recall that linear programming is a technique to find the maximum and the minimum value of a given function over a given system of some inequalities, with each inequality representing a constraint. Graph the inequalities and obtain the vertices of the feasible region (solution set).
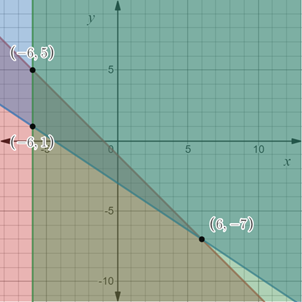
Graph the given inequalities as,

In the above graph, red region represents the inequality
The feasible region is the region common to all the inequalities which is represented as,
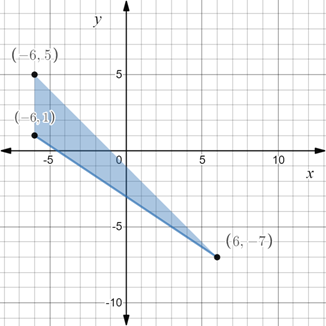
The coordinates of the vertices of the feasible region are
Now, to find the maximum and minimum value of the function, substitute the coordinates of the feasible region in the function and determine the maximum and the minimum value.
So, substitute
From the above table, it is observed that the maximum value of the function is
Thus, graph of the given system of inequalities is,
The coordinates of the feasible region are
Chapter 3 Solutions
Algebra 2
Additional Math Textbook Solutions
Calculus: Early Transcendentals (2nd Edition)
A Problem Solving Approach To Mathematics For Elementary School Teachers (13th Edition)
College Algebra with Modeling & Visualization (5th Edition)
Elementary Statistics (13th Edition)
Elementary Statistics: Picturing the World (7th Edition)


- 1. vector projection. Assume, ER1001 and you know the following: ||||=4, 7=-0.5.7. For each of the following, explicitly compute the value. འབ (a) (b) (c) (d) answer. Explicitly compute ||y7||. Explain your answer. Explicitly compute the cosine similarity of and y. Explain your Explicitly compute (x, y). Explain your answer. Find the projection of onto y and the projection of onto .arrow_forward2. Answer the following questions using vectors u and v. --0-0-0 = find the the cosine similarity and the angle between u and v. འརྒྱ (a) (b) find the scalar projection of u onto v. (c) find the projection of u onto v. (d) (e) (f) find the scalar projection of onto u. find the projection of u onto u. find the projection of u onto and the projection of onto . (Hint: find the inner product and verify the orthogonality)arrow_forwardPlease type out answerarrow_forward
- The function f(x) = log x is transformed to produce g(x) = log (x) – 3. Identify the type of transformation and describe the change. Please type out answerarrow_forwardEach graph below is the graph of a system of three linear equations in three unknowns of the form Ax = b. Determine whether each system has a solution and, if it does, the number of free variables. A. O free variables ✓ B. no solution C. no solution D. no solution E. 1 free variable F. 1 free variablearrow_forwardSolve the following systems of equations and show all work.y = x2 + 3y = x + 5 Please type out answerarrow_forward
- Solve the following system of equations. Show all work and solutions.y = 2x2 + 6x + 1y = −4x2 + 1 Please type out answerarrow_forwardDalia buys 20 collectible gems per month. Grace sells 10 gems from her collection of 120 each month. When will Dalia have more gems than Grace? Show your work. Dear Student If You Face any issue let me know i will solve your all doubt. I will provide solution again in more detail systematic and organized way. I would also like my last 3 questions credited to mearrow_forwardDalia buys 20 collectible gems per month. Grace sells 10 gems from her collection of 120 each month. When will Dalia have more gems than Grace? Show your work.arrow_forward
 Algebra and Trigonometry (6th Edition)AlgebraISBN:9780134463216Author:Robert F. BlitzerPublisher:PEARSON
 Contemporary Abstract AlgebraAlgebraISBN:9781305657960Author:Joseph GallianPublisher:Cengage Learning
 Linear Algebra: A Modern IntroductionAlgebraISBN:9781285463247Author:David PoolePublisher:Cengage Learning
 Algebra And Trigonometry (11th Edition)AlgebraISBN:9780135163078Author:Michael SullivanPublisher:PEARSON
 Introduction to Linear Algebra, Fifth EditionAlgebraISBN:9780980232776Author:Gilbert StrangPublisher:Wellesley-Cambridge Press
 College Algebra (Collegiate Math)AlgebraISBN:9780077836344Author:Julie Miller, Donna GerkenPublisher:McGraw-Hill Education