Videos
a.
To describe: The system of inequalities that represent the number of chairs and tables.
a.
Answer to Problem 15PT
The system of inequalities that represent the number of chairs and tables is
Explanation of Solution
Given information:
The processing to make a table and chair is provided below,
108 hours of carpentry and 20 hours of finishing per day are available. The profit for a table is $35 and for chair is $25.
Calculation:
Consider the provided information thatprocessing to make a table and chair is provided below,
108 hours of carpentry and 20 hours of finishing per day are available. The profit for a table is $35 and for chair is $25.
Let c denote the number of chairs and y denote the number of tables.
The constraints are,
The objective function is,
b.
To graph: The region that depicts the possible number of chair and table manufactured.
b.
Explanation of Solution
Given information:
The system of inequalities that represent the number of chairs and tables is
Graph:
Consider the provided information system of inequalities that represent the number of chairs and tables is
Plot the above inequalities on coordinate plane.

Interpretation:
The shaded region represents the feasible. It is a quadrilateral with 4 corner points.
c.
To calculate:The number of chairs and tables to maximize the profit.
c.
Answer to Problem 15PT
The maximum profit is $700 which is when no chair and 20 tables are made.
Explanation of Solution
Given information:
The processing to make a table and chair is provided below,
108 hours of carpentry and 20 hours of finishing per day are available. The profit for a table is $35 and for chair is $25.
Calculation:
Consider the provided information thatprocessing to make a table and chair is provided below,
108 hours of carpentry and 20 hours of finishing per day are available. The profit for a table is $35 and for chair is $25.
Let c denote the number of chairs and y denote the number of tables.
The constraints are,
The objective function is,
Plot the above inequalities on coordinate plane.
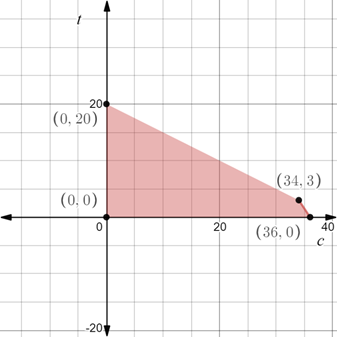
The profit function that is the cost function that is to be maximized is
Substitute the vertices of the feasible region to find the point at which maximum revenue is there.
Substitute
Substitute
Substitute
Substitute
Since, maximum profit is $700 which is when no chair and 20 tables are made.
Chapter 3 Solutions
Algebra 2
Additional Math Textbook Solutions
A Problem Solving Approach To Mathematics For Elementary School Teachers (13th Edition)
Algebra and Trigonometry (6th Edition)
Introductory Statistics
Calculus: Early Transcendentals (2nd Edition)
Intro Stats, Books a la Carte Edition (5th Edition)
Pre-Algebra Student Edition


- 1. Given that h(t) = -5t + 3 t². A tangent line H to the function h(t) passes through the point (-7, B). a. Determine the value of ẞ. b. Derive an expression to represent the gradient of the tangent line H that is passing through the point (-7. B). c. Hence, derive the straight-line equation of the tangent line H 2. The function p(q) has factors of (q − 3) (2q + 5) (q) for the interval -3≤ q≤ 4. a. Derive an expression for the function p(q). b. Determine the stationary point(s) of the function p(q) c. Classify the stationary point(s) from part b. above. d. Identify the local maximum of the function p(q). e. Identify the global minimum for the function p(q). 3. Given that m(q) = -3e-24-169 +9 (-39-7)(-In (30-755 a. State all the possible rules that should be used to differentiate the function m(q). Next to the rule that has been stated, write the expression(s) of the function m(q) for which that rule will be applied. b. Determine the derivative of m(q)arrow_forwardSafari File Edit View History Bookmarks Window Help Ο Ω OV O mA 0 mW ర Fri Apr 4 1 222 tv A F9 F10 DII 4 F6 F7 F8 7 29 8 00 W E R T Y U S D பட 9 O G H J K E F11 + 11 F12 O P } [arrow_forwardSo confused. Step by step instructions pleasearrow_forward
- In simplest terms, Sketch the graph of the parabola. Then, determine its equation. opens downward, vertex is (- 4, 7), passes through point (0, - 39)arrow_forwardIn simplest way, For each quadratic relation, find the zeros and the maximum or minimum. a) y = x 2 + 16 x + 39 b) y = 5 x2 - 50 x - 120arrow_forwardIn simplest terms and step by step Write each quadratic relation in standard form, then fi nd the zeros. y = - 4( x + 6)2 + 36arrow_forward
- In simplest terms and step by step For each quadratic relation, find the zeros and the maximum or minimum. 1) y = - 2 x2 - 28 x + 64 2) y = 6 x2 + 36 x - 42arrow_forwardWrite each relation in standard form a)y = 5(x + 10)2 + 7 b)y = 9(x - 8)2 - 4arrow_forwardIn simplest form and step by step Write the quadratic relation in standard form, then fi nd the zeros. y = 3(x - 1)2 - 147arrow_forward
- Step by step instructions The path of a soccer ball can be modelled by the relation h = - 0.1 d 2 + 0.5 d + 0.6, where h is the ball’s height and d is the horizontal distance from the kicker. a) Find the zeros of the relation.arrow_forwardIn simplest terms and step by step how do you find the zeros of y = 6x2 + 24x - 192arrow_forwardStep by step Find the zeros of each quadratic relation. a) y = x2 - 16xarrow_forward
 Algebra and Trigonometry (6th Edition)AlgebraISBN:9780134463216Author:Robert F. BlitzerPublisher:PEARSON
 Contemporary Abstract AlgebraAlgebraISBN:9781305657960Author:Joseph GallianPublisher:Cengage Learning
 Linear Algebra: A Modern IntroductionAlgebraISBN:9781285463247Author:David PoolePublisher:Cengage Learning
 Algebra And Trigonometry (11th Edition)AlgebraISBN:9780135163078Author:Michael SullivanPublisher:PEARSON
 Introduction to Linear Algebra, Fifth EditionAlgebraISBN:9780980232776Author:Gilbert StrangPublisher:Wellesley-Cambridge Press
 College Algebra (Collegiate Math)AlgebraISBN:9780077836344Author:Julie Miller, Donna GerkenPublisher:McGraw-Hill Education