
Concept explainers
Videos
(a)
To make a
(a)
Explanation of Solution
The scatterplot with HbA as the explanatory variable is as:
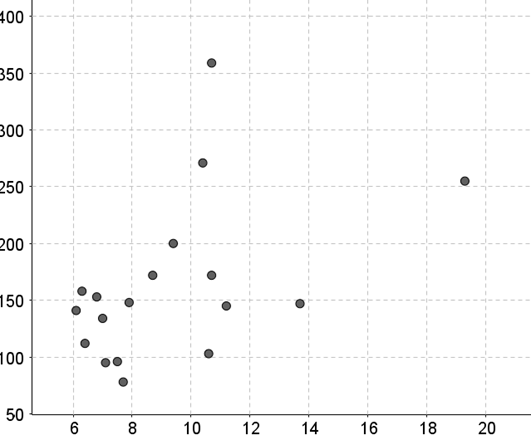
From the scatterplot we can say that, the scatterplot confirms a positive linear relationship, because the scatterplot slopes upwards. The scatterplot confirms a weak relationship, because the points seem to lie far apart.
(b)
To explain what effect do you think this subject has on the
(b)
Answer to Problem 69E
No, they do not affect.
Explanation of Solution
Now, we have to calculate the correlation by using the excel
First we will put the data in the excel file and then we will use the function for the correlation, that is,
CORREL function returns the
AVERAGE function returns the average of the
For the case with outlier:
Thus, the calculation will be as:
| Correlation | =CORREL(H1:H18,I1:I18) |
And the result will be as:
| Correlation | 0.4506 |
Thus, the slope will be,
And the y intercept will be,
The regression line will be as:
For the case without outlier:
Thus, the calculation will be as:
| Correlation | =CORREL(H1:H17,I1:I17) |
And the result will be as:
| Correlation | 0.3837 |
Thus, the slope will be,
And the y intercept will be,
The regression line will be as:
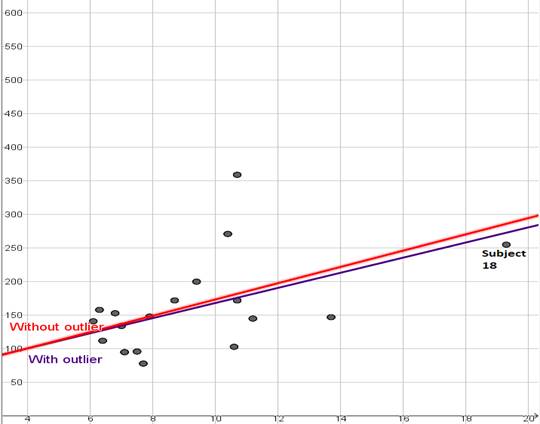
Thus, we note that the correlation coefficient with the outlier is more than the correlation coefficient without outlier. We then note that the outlier increases the correlation due to the fact that subject
(c)
To explain what effect do you think this subject has on the correlation and on the equation of the least squares regression line and calculate the correlation and equation of the least squares regression line with and without this subject to confirm your answer.
(c)
Answer to Problem 69E
It makes the regression line steeper.
Explanation of Solution
Now, we have to calculate the correlation by using the excel function as:
First we will put the data in the excel file and then we will use the function for the correlation, that is,
CORREL function returns the correlation coefficient of the
AVERAGE function returns the average of the
For the case with outlier:
Thus, the calculation will be as:
| Correlation | =CORREL(H1:H18,I1:I18) |
And the result will be as:
| Correlation | 0.4506 |
Thus, the slope will be,
And the y intercept will be,
The regression line will be as:
For the case without outlier:
Thus, the calculation will be as:
| Correlation | =CORREL(H1:H17,I1:I17) |
And the result will be as:
| Correlation | 0.5684 |
Thus, the slope will be,
And the y intercept will be,
The regression line will be as:
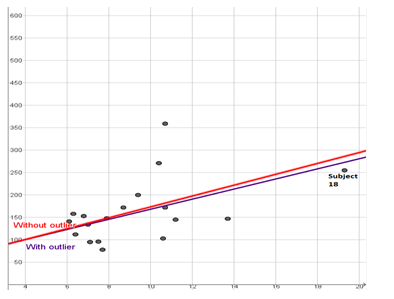
Thus, we note that the correlation coefficient with the outlier is less than the correlation coefficient without outlier. We then note that the outlier decreases the correlation due to the fact that subject
Chapter 3 Solutions
PRACTICE OF STATISTICS F/AP EXAM
Additional Math Textbook Solutions
University Calculus: Early Transcendentals (4th Edition)
Basic Business Statistics, Student Value Edition
Calculus for Business, Economics, Life Sciences, and Social Sciences (14th Edition)
Elementary Statistics (13th Edition)
College Algebra (7th Edition)


- please find the answers for the yellows boxes using the information and the picture belowarrow_forwardA marketing agency wants to determine whether different advertising platforms generate significantly different levels of customer engagement. The agency measures the average number of daily clicks on ads for three platforms: Social Media, Search Engines, and Email Campaigns. The agency collects data on daily clicks for each platform over a 10-day period and wants to test whether there is a statistically significant difference in the mean number of daily clicks among these platforms. Conduct ANOVA test. You can provide your answer by inserting a text box and the answer must include: also please provide a step by on getting the answers in excel Null hypothesis, Alternative hypothesis, Show answer (output table/summary table), and Conclusion based on the P value.arrow_forwardA company found that the daily sales revenue of its flagship product follows a normal distribution with a mean of $4500 and a standard deviation of $450. The company defines a "high-sales day" that is, any day with sales exceeding $4800. please provide a step by step on how to get the answers Q: What percentage of days can the company expect to have "high-sales days" or sales greater than $4800? Q: What is the sales revenue threshold for the bottom 10% of days? (please note that 10% refers to the probability/area under bell curve towards the lower tail of bell curve) Provide answers in the yellow cellsarrow_forward
- Business Discussarrow_forwardThe following data represent total ventilation measured in liters of air per minute per square meter of body area for two independent (and randomly chosen) samples. Analyze these data using the appropriate non-parametric hypothesis testarrow_forwardeach column represents before & after measurements on the same individual. Analyze with the appropriate non-parametric hypothesis test for a paired design.arrow_forward
- Should you be confident in applying your regression equation to estimate the heart rate of a python at 35°C? Why or why not?arrow_forwardGiven your fitted regression line, what would be the residual for snake #5 (10 C)?arrow_forwardCalculate the 95% confidence interval around your estimate of r using Fisher’s z-transformation. In your final answer, make sure to back-transform to the original units.arrow_forward
 MATLAB: An Introduction with ApplicationsStatisticsISBN:9781119256830Author:Amos GilatPublisher:John Wiley & Sons Inc
 Probability and Statistics for Engineering and th...StatisticsISBN:9781305251809Author:Jay L. DevorePublisher:Cengage Learning
 Statistics for The Behavioral Sciences (MindTap C...StatisticsISBN:9781305504912Author:Frederick J Gravetter, Larry B. WallnauPublisher:Cengage Learning
 Elementary Statistics: Picturing the World (7th E...StatisticsISBN:9780134683416Author:Ron Larson, Betsy FarberPublisher:PEARSON
 The Basic Practice of StatisticsStatisticsISBN:9781319042578Author:David S. Moore, William I. Notz, Michael A. FlignerPublisher:W. H. Freeman
 Introduction to the Practice of StatisticsStatisticsISBN:9781319013387Author:David S. Moore, George P. McCabe, Bruce A. CraigPublisher:W. H. Freeman