
Concept explainers
Videos
(a)
Whether all five specimens come from same species.
(a)
Answer to Problem 21E
Yes, all five specimens come from same species.
Explanation of Solution
Given information:
Data on the lengths (in centimeters) of the femur (a leg bone) and the humerus (a bone in the upper arm):

For scatterplot:
On horizontal x − axis:
Femur (in centimeters)
On vertical y − axis:
Humerus (in centimeters):
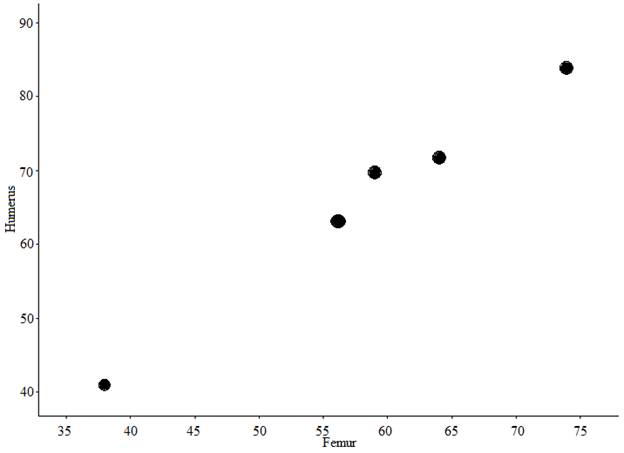
Note that
All points form a linear pattern.
Thus,
We can say
All five species come from the same species.
(b)
(b)
Answer to Problem 21E
Correlation,
Explanation of Solution
Given information:
Data on the lengths (in centimeters) of the femur (a leg bone) and the humerus (a bone in the upper arm):

From the given table,
Find xy , x2 , y2 :
| x | y | xy | x2 | y2 |
| 38 56 59 64 74 | 41 63 70 72 84 | 1558 3528 4130 4608 6216 | 1444 3136 3481 4096 5476 | 1681 3969 4900 5184 7056 |
Now,
Sum up every column:
Formula to estimate the
Substitute the values:
Since all five specimens come from the same species and all the points are lying on the same line.
Thus,
The value of correlation matches with the graph in Part (a).
Chapter 3 Solutions
PRACTICE OF STATISTICS F/AP EXAM
Additional Math Textbook Solutions
Calculus: Early Transcendentals (2nd Edition)
Thinking Mathematically (6th Edition)
Pre-Algebra Student Edition
Algebra and Trigonometry (6th Edition)
University Calculus: Early Transcendentals (4th Edition)


- A researcher wishes to estimate, with 90% confidence, the population proportion of adults who support labeling legislation for genetically modified organisms (GMOs). Her estimate must be accurate within 4% of the true proportion. (a) No preliminary estimate is available. Find the minimum sample size needed. (b) Find the minimum sample size needed, using a prior study that found that 65% of the respondents said they support labeling legislation for GMOs. (c) Compare the results from parts (a) and (b). ... (a) What is the minimum sample size needed assuming that no prior information is available? n = (Round up to the nearest whole number as needed.)arrow_forwardThe table available below shows the costs per mile (in cents) for a sample of automobiles. At a = 0.05, can you conclude that at least one mean cost per mile is different from the others? Click on the icon to view the data table. Let Hss, HMS, HLS, Hsuv and Hмy represent the mean costs per mile for small sedans, medium sedans, large sedans, SUV 4WDs, and minivans respectively. What are the hypotheses for this test? OA. Ho: Not all the means are equal. Ha Hss HMS HLS HSUV HMV B. Ho Hss HMS HLS HSUV = μMV Ha: Hss *HMS *HLS*HSUV * HMV C. Ho Hss HMS HLS HSUV =μMV = = H: Not all the means are equal. D. Ho Hss HMS HLS HSUV HMV Ha Hss HMS HLS =HSUV = HMVarrow_forwardQuestion: A company launches two different marketing campaigns to promote the same product in two different regions. After one month, the company collects the sales data (in units sold) from both regions to compare the effectiveness of the campaigns. The company wants to determine whether there is a significant difference in the mean sales between the two regions. Perform a two sample T-test You can provide your answer by inserting a text box and the answer must include: Null hypothesis, Alternative hypothesis, Show answer (output table/summary table), and Conclusion based on the P value. (2 points = 0.5 x 4 Answers) Each of these is worth 0.5 points. However, showing the calculation is must. If calculation is missing, the whole answer won't get any credit.arrow_forward
- Binomial Prob. Question: A new teaching method claims to improve student engagement. A survey reveals that 60% of students find this method engaging. If 15 students are randomly selected, what is the probability that: a) Exactly 9 students find the method engaging?b) At least 7 students find the method engaging? (2 points = 1 x 2 answers) Provide answers in the yellow cellsarrow_forwardIn a survey of 2273 adults, 739 say they believe in UFOS. Construct a 95% confidence interval for the population proportion of adults who believe in UFOs. A 95% confidence interval for the population proportion is ( ☐, ☐ ). (Round to three decimal places as needed.)arrow_forwardFind the minimum sample size n needed to estimate μ for the given values of c, σ, and E. C=0.98, σ 6.7, and E = 2 Assume that a preliminary sample has at least 30 members. n = (Round up to the nearest whole number.)arrow_forward
 MATLAB: An Introduction with ApplicationsStatisticsISBN:9781119256830Author:Amos GilatPublisher:John Wiley & Sons Inc
 Probability and Statistics for Engineering and th...StatisticsISBN:9781305251809Author:Jay L. DevorePublisher:Cengage Learning
 Statistics for The Behavioral Sciences (MindTap C...StatisticsISBN:9781305504912Author:Frederick J Gravetter, Larry B. WallnauPublisher:Cengage Learning
 Elementary Statistics: Picturing the World (7th E...StatisticsISBN:9780134683416Author:Ron Larson, Betsy FarberPublisher:PEARSON
 The Basic Practice of StatisticsStatisticsISBN:9781319042578Author:David S. Moore, William I. Notz, Michael A. FlignerPublisher:W. H. Freeman
 Introduction to the Practice of StatisticsStatisticsISBN:9781319013387Author:David S. Moore, George P. McCabe, Bruce A. CraigPublisher:W. H. Freeman