Cornerstones of Cost Management (Cornerstones Series)
4th Edition
ISBN: 9781305970663
Author: Don R. Hansen, Maryanne M. Mowen
Publisher: Cengage Learning
expand_more
expand_more
format_list_bulleted
Concept explainers
Textbook Question
Chapter 3, Problem 6CE
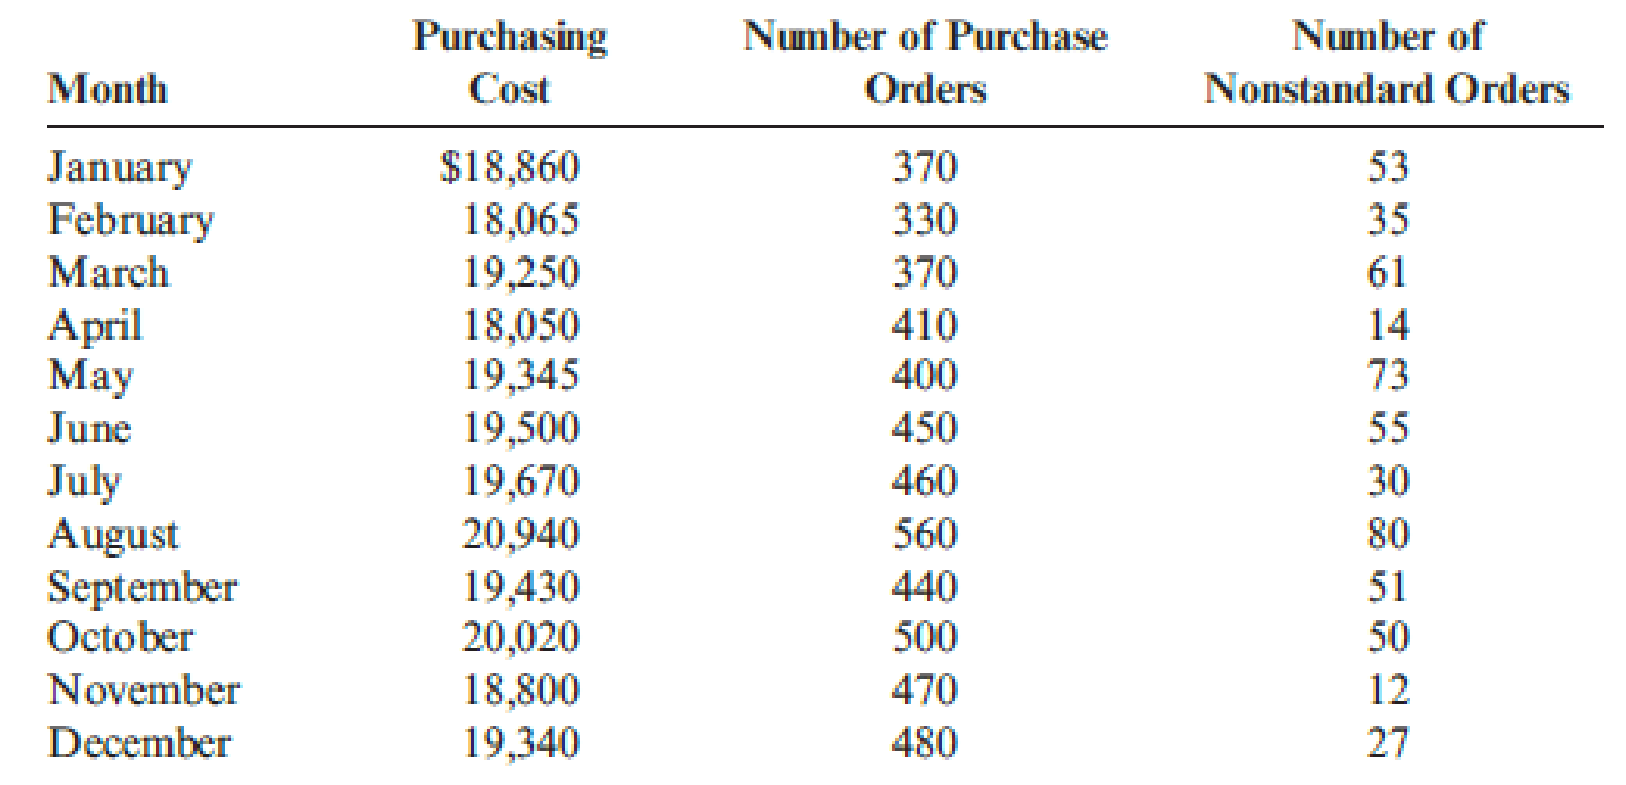
The controller for Dohini Manufacturing Company felt that the number of purchase orders alone did not explain the monthly purchasing cost. He knew that nonstandard orders (for example, one requiring an overseas supplier) took more time and effort. He collected data on the number of nonstandard orders for the past 12 months and added that information to the data on purchasing cost and total number of purchase orders.

Multiple regression was run on the above data; the coefficients shown by the regression program are:

Required:
- 1. Construct the cost formula for the purchasing activity showing the fixed cost and the variable rate.
- 2. If Dohini Manufacturing Company estimates that next month will have 430 total purchase orders and 45 nonstandard orders, what is the total estimated purchasing cost for that month? (Round your answer to the nearest dollar.)
- 3. What if Dohini Manufacturing wants to estimate purchasing cost for the coming year and expects 5,340 purchase orders and 580 nonstandard orders? What will estimated total purchasing cost be? What is the total fixed purchasing cost? Why doesn’t it equal the fixed cost calculated in Requirement 2? (Round your answers to the nearest dollar.)
Expert Solution & Answer
Trending nowThis is a popular solution!

Students have asked these similar questions
Velocity Enterprises recorded the following sales data please answer the financial accounting question
On January 1, 2020, Nexus Technologies purchased a machine for $15,000. The machine was estimated to have a 10-year useful life and a residual value of $800. Straight-line depreciation is used. On January 1, 2022, the machine was exchanged for office equipment with a fair value of $12,500. Assuming that the exchange had commercial substance, how much would be recorded as a gain on disposal of the machine on January 1, 2022? help
i need correct option
Chapter 3 Solutions
Cornerstones of Cost Management (Cornerstones Series)
Ch. 3 - Why is knowledge of cost behavior important for...Ch. 3 - How does the length of the time horizon affect the...Ch. 3 - Prob. 3DQCh. 3 - What is the relationship between flexible...Ch. 3 - What is the relationship between committed...Ch. 3 - Describe the difference between a variable cost...Ch. 3 - Why do mixed costs pose a problem when it comes to...Ch. 3 - Why is a scattergraph a good first step in...Ch. 3 - What are the advantages of the scatterplot method...Ch. 3 - Prob. 10DQ
Ch. 3 - What is meant by the best-fitting line? Is the...Ch. 3 - When is multiple regression required to explain...Ch. 3 - Explain the meaning of the learning curve. How do...Ch. 3 - Assume you are the manager responsible for...Ch. 3 - Some firms assign mixed costs to either the fixed...Ch. 3 - Callies Gym is a complete fitness center. Owner...Ch. 3 - Corazon Manufacturing Company has a purchasing...Ch. 3 - Darnell Poston, owner of Poston Manufacturing,...Ch. 3 - Dohini Manufacturing Company had the following 12...Ch. 3 - Refer to Cornerstone Exercise 3.4 for data on...Ch. 3 - The controller for Dohini Manufacturing Company...Ch. 3 - Prob. 7CECh. 3 - State Universitys football team just received a...Ch. 3 - Classify the following costs of activity inputs as...Ch. 3 - SmokeCity, Inc., manufactures barbeque smokers....Ch. 3 - Cashion Company produces chemical mixtures for...Ch. 3 - For the following activities and their associated...Ch. 3 - Prob. 13ECh. 3 - Vargas, Inc., produces industrial machinery....Ch. 3 - Penny Davis runs the Shear Beauty Salon near a...Ch. 3 - Shirrell Blackthorn is the accountant for several...Ch. 3 - Deepa Dalal opened a free-standing radiology...Ch. 3 - Prob. 18ECh. 3 - The controller of the South Charleston plant of...Ch. 3 - Lassiter Company used the method of least squares...Ch. 3 - Sweet Dreams Bakery was started five years ago by...Ch. 3 - Ginnian and Fitch, a regional accounting firm,...Ch. 3 - Bordner Company manufactures HVAC (heating,...Ch. 3 - Sharon Glessing, controller for Janson Company,...Ch. 3 - The graphs below represent cost behavior patterns...Ch. 3 - Starling Co. manufactures one product with a...Ch. 3 - Alard Manufacturing Company has a billing...Ch. 3 - Prob. 28ECh. 3 - Prob. 29ECh. 3 - Natur-Gro, Inc., manufactures composters. Based on...Ch. 3 - Rolertyme Company manufactures roller skates. With...Ch. 3 - St. Teresas Medical Center (STMC) offers a number...Ch. 3 - Big Mikes, a large hardware store, has gathered...Ch. 3 - Kimball Company has developed the following cost...Ch. 3 - The management of Wheeler Company has decided to...Ch. 3 - DeMarco Company is developing a cost formula for...Ch. 3 - Weber Valley Regional Hospital has collected data...Ch. 3 - Friendly Bank is attempting to determine the cost...Ch. 3 - Randy Harris, controller, has been given the...Ch. 3 - The Lockit Company manufactures door knobs for...Ch. 3 - Harriman Industries manufactures engines for the...Ch. 3 - Thames Assurance Company sells a variety of life...
Knowledge Booster
Learn more about
Need a deep-dive on the concept behind this application? Look no further. Learn more about this topic, accounting and related others by exploring similar questions and additional content below.Similar questions
- Give me solutionarrow_forwardFinancial Accounting Questionarrow_forwardOn January 1, 2020, Nexus Technologies purchased a machine for $15,000. The machine was estimated to have a 10-year useful life and a residual value of $800. Straight-line depreciation is used. On January 1, 2022, the machine was exchanged for office equipment with a fair value of $12,500. Assuming that the exchange had commercial substance, how much would be recorded as a gain on disposal of the machine on January 1, 2022?arrow_forward
- Variable and Absorption Costing Summarized data for the first year of operations for Gorman Products, Inc., are as follows: Sales (70,000 units) Production costs (80,000 units) Direct material Direct labor Manufacturing overhead: Variable Fixed Operating expenses: Variable $2,800,000 880,000 720,000 544,000 320,000 175,000 Fixed 240,000 Depreciation on equipment 60,000 Real estate taxes 18,000 Personal property taxes (inventory & equipment) 28,800 Personnel department expenses 30,000 a. Prepare an income statement based on full absorption costing. Only use a negative sign with your answer for net income (loss), if the answer represents a net loss. Otherwise, do not use negative signs with any answers. Round answers to the nearest whole number, when applicable. Sales Cost of Goods Sold: Absorption Costing Income Statement Beginning Inventory $ 2,800,000 Direct materials Direct labor Manufacturing overhead Less: Ending Inventory Cost of Goods Sold Gross profit $ 880,000 720,000 864,000…arrow_forwardAccurate answerarrow_forwardanswer plzarrow_forward
- What is the sales margin for the division of the financial accounting?arrow_forwardMartin Corporation incurs a cost of $38.65 per unit, of which $22.35 is variable, to make a product that normally sells for $60.50. A foreign wholesaler offers to buy 6,100 units at $34.20 each. Martin will incur additional costs of $2.85 per unit to imprint a logo and to pay for shipping. Compute the increase or decrease in net income Martin will realize by accepting the special order, assuming the company has sufficient excess operating capacity.arrow_forwardTitan Industries purchased a machine for $40,000 with a residual value of $6,000 and an estimated useful life of 12 years. What is the annual depreciation under the straight-line method?arrow_forward
arrow_back_ios
SEE MORE QUESTIONS
arrow_forward_ios
Recommended textbooks for you
 Cornerstones of Cost Management (Cornerstones Ser...AccountingISBN:9781305970663Author:Don R. Hansen, Maryanne M. MowenPublisher:Cengage Learning
 Essentials of Business Analytics (MindTap Course ...StatisticsISBN:9781305627734Author:Jeffrey D. Camm, James J. Cochran, Michael J. Fry, Jeffrey W. Ohlmann, David R. AndersonPublisher:Cengage Learning
 Managerial AccountingAccountingISBN:9781337912020Author:Carl Warren, Ph.d. Cma William B. TaylerPublisher:South-Western College Pub
 Managerial Accounting: The Cornerstone of Busines...AccountingISBN:9781337115773Author:Maryanne M. Mowen, Don R. Hansen, Dan L. HeitgerPublisher:Cengage Learning
 Essentials Of Business AnalyticsStatisticsISBN:9781285187273Author:Camm, Jeff.Publisher:Cengage Learning,Principles of Accounting Volume 2AccountingISBN:9781947172609Author:OpenStaxPublisher:OpenStax College

Cornerstones of Cost Management (Cornerstones Ser...
Accounting
ISBN:9781305970663
Author:Don R. Hansen, Maryanne M. Mowen
Publisher:Cengage Learning

Essentials of Business Analytics (MindTap Course ...
Statistics
ISBN:9781305627734
Author:Jeffrey D. Camm, James J. Cochran, Michael J. Fry, Jeffrey W. Ohlmann, David R. Anderson
Publisher:Cengage Learning

Managerial Accounting
Accounting
ISBN:9781337912020
Author:Carl Warren, Ph.d. Cma William B. Tayler
Publisher:South-Western College Pub

Managerial Accounting: The Cornerstone of Busines...
Accounting
ISBN:9781337115773
Author:Maryanne M. Mowen, Don R. Hansen, Dan L. Heitger
Publisher:Cengage Learning

Essentials Of Business Analytics
Statistics
ISBN:9781285187273
Author:Camm, Jeff.
Publisher:Cengage Learning,

Principles of Accounting Volume 2
Accounting
ISBN:9781947172609
Author:OpenStax
Publisher:OpenStax College
Pricing Decisions; Author: Rutgers Accounting Web;https://www.youtube.com/watch?v=rQHbIVEAOvM;License: Standard Youtube License