Cornerstones of Cost Management (Cornerstones Series)
4th Edition
ISBN: 9781305970663
Author: Don R. Hansen, Maryanne M. Mowen
Publisher: Cengage Learning
expand_more
expand_more
format_list_bulleted
Concept explainers
Textbook Question
Chapter 3, Problem 35P
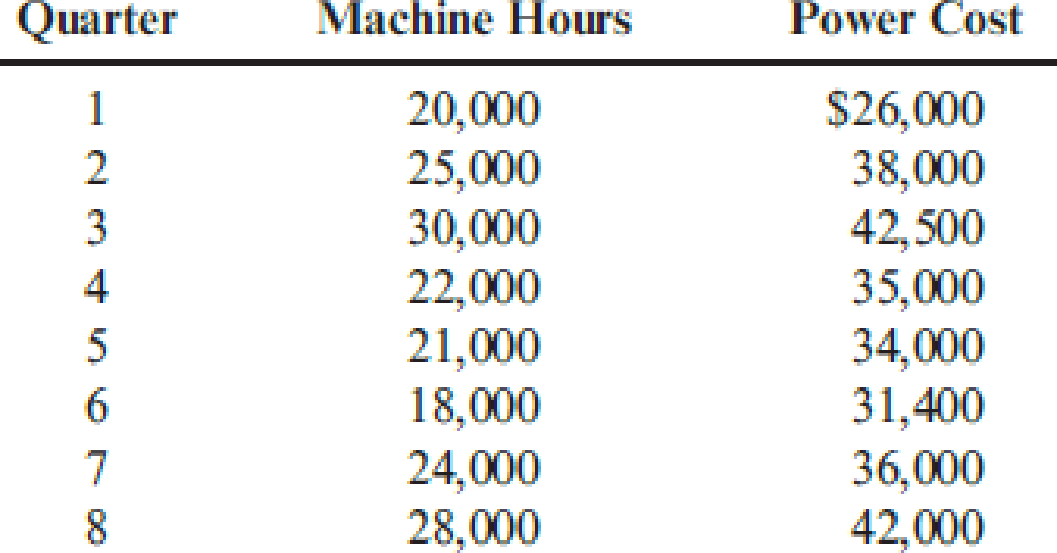
The management of Wheeler Company has decided to develop cost formulas for its major
Required:
- 1. Prepare a scattergraph by plotting power costs against machine hours. Does the scatter-graph show a linear relationship between machine hours and power cost?
- 2. Using the high and low points, compute a power cost formula.
- 3. Use the method of least squares to compute a power cost formula. Evaluate the coefficient of determination.
- 4. Rerun the regression and drop the point (20,000; $26,000) as an outlier. Compare the results from this regression to those for the regression in Requirement 3. Which is better?
Expert Solution & Answer
Trending nowThis is a popular solution!
Students have asked these similar questions
The management of Wheeler Company has decided to develop cost formulas for its major overhead activities. Wheeler uses a highly automated manufacturing process, and power costs are a significant manufacturing cost. Cost analysts have decided that power costs are mixed;
thus, they must be broken into their fixed and variable elements so that the cost behavior of the power usage activity can be properly described. Machine hours have been selected as the activity driver for power costs. The following data for the past eight quarters have been
collected:
2 25000
38000
3 30000 42500
4 22000 35000
5 21000 34000
6 18000 31400
7 24000 36000
8 28000 42000
Prompt
Work with your group members to answer the following prompts:
Prepare a scattergraph by plotting power costs against machine hours. Does the scattergraph show a linear relationship between machine hours and power cost? Use scattergraph method to draw a cost line that best fits the data and estimate the cost function.
Using high and low…
Scattergraph, High–Low Method, and Predicting Cost for a Different Time Period from the One Used to Develop a Cost Formula
Farnsworth Company has gathered data on its overhead activities and associated costs for the past 10 months. Tracy Heppler, a member of the controller's department, has convinced management that overhead costs can be better estimated and controlled if the fixed and variable components of each overhead activity are known. One such activity is receiving raw materials (unloading incoming goods, counting goods, and inspecting goods), which she believes is driven by the number of receiving orders. Ten months of data have been gathered for the receiving activity and are as follows:
Month
Receiving Orders
Receiving Cost ($)
1
1,000
27,000
2
700
22,500
3
1,500
42,000
4
1,200
25,500
5
1,300
37,500
6
1,100
31,500
7
1,600
43,500
8
1,400
36,000
9
1,700
40,500
10
900
24,000
Required:
1. On your own paper, prepare a scattergraph based on the 10…
Schell Company manufactures automobile floor mats. It currently has two product lines, the Standard and the Deluxe. Suppose that
Schell has conducted further research into its overhead and potential cost drivers. As a result, the company has compiled the following
detailed information, breaking total overhead into three activity pools:
Activity Pools
Material handling
Quality control
Machine maintenance
Req 1
Cost Driver
Number of moves
Number of inspections
Number of machine hours
Req 2 and 3
Required:
1. Calculate the activity rates for each activity pool assuming Schell uses an ABC system.
2. Calculate the amount of overhead that Schell will assign to the Standard floor mat line.
3. Determine the amount of overhead Schell will assign to the Deluxe product line.
Complete this question by entering your answers in the tabs below.
Material Handling
Quality Control
Machine maintenance
Cost Assigned
to Pool
Activity Rate
$ 2,068.00
$ 8,640.00
$ 14,120.00
Calculate the activity rates for…
Chapter 3 Solutions
Cornerstones of Cost Management (Cornerstones Series)
Ch. 3 - Why is knowledge of cost behavior important for...Ch. 3 - How does the length of the time horizon affect the...Ch. 3 - Prob. 3DQCh. 3 - What is the relationship between flexible...Ch. 3 - What is the relationship between committed...Ch. 3 - Describe the difference between a variable cost...Ch. 3 - Why do mixed costs pose a problem when it comes to...Ch. 3 - Why is a scattergraph a good first step in...Ch. 3 - What are the advantages of the scatterplot method...Ch. 3 - Prob. 10DQ
Ch. 3 - What is meant by the best-fitting line? Is the...Ch. 3 - When is multiple regression required to explain...Ch. 3 - Explain the meaning of the learning curve. How do...Ch. 3 - Assume you are the manager responsible for...Ch. 3 - Some firms assign mixed costs to either the fixed...Ch. 3 - Callies Gym is a complete fitness center. Owner...Ch. 3 - Corazon Manufacturing Company has a purchasing...Ch. 3 - Darnell Poston, owner of Poston Manufacturing,...Ch. 3 - Dohini Manufacturing Company had the following 12...Ch. 3 - Refer to Cornerstone Exercise 3.4 for data on...Ch. 3 - The controller for Dohini Manufacturing Company...Ch. 3 - Prob. 7CECh. 3 - State Universitys football team just received a...Ch. 3 - Classify the following costs of activity inputs as...Ch. 3 - SmokeCity, Inc., manufactures barbeque smokers....Ch. 3 - Cashion Company produces chemical mixtures for...Ch. 3 - For the following activities and their associated...Ch. 3 - Prob. 13ECh. 3 - Vargas, Inc., produces industrial machinery....Ch. 3 - Penny Davis runs the Shear Beauty Salon near a...Ch. 3 - Shirrell Blackthorn is the accountant for several...Ch. 3 - Deepa Dalal opened a free-standing radiology...Ch. 3 - Prob. 18ECh. 3 - The controller of the South Charleston plant of...Ch. 3 - Lassiter Company used the method of least squares...Ch. 3 - Sweet Dreams Bakery was started five years ago by...Ch. 3 - Ginnian and Fitch, a regional accounting firm,...Ch. 3 - Bordner Company manufactures HVAC (heating,...Ch. 3 - Sharon Glessing, controller for Janson Company,...Ch. 3 - The graphs below represent cost behavior patterns...Ch. 3 - Starling Co. manufactures one product with a...Ch. 3 - Alard Manufacturing Company has a billing...Ch. 3 - Prob. 28ECh. 3 - Prob. 29ECh. 3 - Natur-Gro, Inc., manufactures composters. Based on...Ch. 3 - Rolertyme Company manufactures roller skates. With...Ch. 3 - St. Teresas Medical Center (STMC) offers a number...Ch. 3 - Big Mikes, a large hardware store, has gathered...Ch. 3 - Kimball Company has developed the following cost...Ch. 3 - The management of Wheeler Company has decided to...Ch. 3 - DeMarco Company is developing a cost formula for...Ch. 3 - Weber Valley Regional Hospital has collected data...Ch. 3 - Friendly Bank is attempting to determine the cost...Ch. 3 - Randy Harris, controller, has been given the...Ch. 3 - The Lockit Company manufactures door knobs for...Ch. 3 - Harriman Industries manufactures engines for the...Ch. 3 - Thames Assurance Company sells a variety of life...
Knowledge Booster
Learn more about
Need a deep-dive on the concept behind this application? Look no further. Learn more about this topic, accounting and related others by exploring similar questions and additional content below.Similar questions
- Larsen, Inc., produces two types of electronic parts and has provided the following data: There are four activities: machining, setting up, testing, and purchasing. Required: 1. Calculate the activity consumption ratios for each product. 2. Calculate the consumption ratios for the plantwide rate (direct labor hours). When compared with the activity ratios, what can you say about the relative accuracy of a plantwide rate? Which product is undercosted? 3. What if the machine hours were used for the plantwide rate? Would this remove the cost distortion of a plantwide rate?arrow_forwardEvans, Inc., has a unit-based costing system. Evanss Miami plant produces 10 different electronic products. The demand for each product is about the same. Although they differ in complexity, each product uses about the same labor time and materials. The plant has used direct labor hours for years to assign overhead to products. To help design engineers understand the assumed cost relationships, the Cost Accounting Department developed the following cost equation. (The equation describes the relationship between total manufacturing costs and direct labor hours; the equation is supported by a coefficient of determination of 60 percent.) Y=5,000,000+30X,whereX=directlaborhours The variable rate of 30 is broken down as follows: Because of competitive pressures, product engineering was given the charge to redesign products to reduce the total cost of manufacturing. Using the above cost relationships, product engineering adopted the strategy of redesigning to reduce direct labor content. As each design was completed, an engineering change order was cut, triggering a series of events such as design approval, vendor selection, bill of materials update, redrawing of schematic, test runs, changes in setup procedures, development of new inspection procedures, and so on. After one year of design changes, the normal volume of direct labor was reduced from 250,000 hours to 200,000 hours, with the same number of products being produced. Although each product differs in its labor content, the redesign efforts reduced the labor content for all products. On average, the labor content per unit of product dropped from 1.25 hours per unit to one hour per unit. Fixed overhead, however, increased from 5,000,000 to 6,600,000 per year. Suppose that a consultant was hired to explain the increase in fixed overhead costs. The consultants study revealed that the 30 per hour rate captured the unit-level variable costs; however, the cost behavior of other activities was quite different. For example, setting up equipment is a step-fixed cost, where each step is 2,000 setup hours, costing 90,000. The study also revealed that the cost of receiving goods is a function of the number of different components. This activity has a variable cost of 2,000 per component type and a fixed cost that follows a step-cost pattern. The step is defined by 20 components with a cost of 50,000 per step. Assume also that the consultant indicated that the design adopted by the engineers increased the demand for setups from 20,000 setup hours to 40,000 setup hours and the number of different components from 100 to 250. The demand for other non-unit-level activities remained unchanged. The consultant also recommended that management take a look at a rejected design for its products. This rejected design increased direct labor content from 250,000 hours to 260,000 hours, decreased the demand for setups from 20,000 hours to 10,000 hours, and decreased the demand for purchasing from 100 component types to 75 component types, while the demand for all other activities remained unchanged. Required: 1. Using normal volume, compute the manufacturing cost per labor hour before the year of design changes. What is the cost per unit of an average product? 2. Using normal volume after the one year of design changes, compute the manufacturing cost per hour. What is the cost per unit of an average product? 3. Before considering the consultants study, what do you think is the most likely explanation for the failure of the design changes to reduce manufacturing costs? Now use the information from the consultants study to explain the increase in the average cost per unit of product. What changes would you suggest to improve Evanss efforts to reduce costs? 4. Explain why the consultant recommended a second look at a rejected design. Provide computational support. What does this tell you about the strategic importance of cost management?arrow_forwardThe controller of the South Charleston plant of Ravinia, Inc., monitored activities associated with materials handling costs. The high and low levels of resource usage occurred in September and March for three different resources associated with materials handling. The number of moves is the driver. The total costs of the three resources and the activity output, as measured by moves for the two different levels, are presented as follows: Required: 1. Determine the cost behavior formula of each resource. Use the high-low method to assess the fixed and variable components. 2. Using your knowledge of cost behavior, predict the cost of each item for an activity output level of 9,000 moves. 3. Construct a cost formula that can be used to predict the total cost of the three resources combined. Using this formula, predict the total materials handling cost if activity output is 9,000 moves. In general, when can cost formulas be combined to form a single cost formula?arrow_forward
- The management of Hartman Company is trying to determine the amount of each of two products to produce over the coming planning period. The following information concerns labor availability, labor utilization, and product profitability: a. Develop a linear programming model of the Hartman Company problem. Solve the model to determine the optimal production quantities of products 1 and 2. b. In computing the profit contribution per unit, management does not deduct labor costs because they are considered fixed for the upcoming planning period. However, suppose that overtime can be scheduled in some of the departments. Which departments would you recommend scheduling for overtime? How much would you be willing to pay per hour of overtime in each department? c. Suppose that 10, 6, and 8 hours of overtime may be scheduled in departments A, B, and C, respectively. The cost per hour of overtime is 18 in department A, 22.50 in department B, and 12 in department C. Formulate a linear programming model that can be used to determine the optimal production quantities if overtime is made available. What are the optimal production quantities, and what is the revised total contribution to profit? How much overtime do you recommend using in each department? What is the increase in the total contribution to profit if overtime is used?arrow_forwardSilven Company has identified the following overhead activities, costs, and activity drivers for the coming year: Silven produces two models of cell phones with the following expected activity demands: 1. Determine the total overhead assigned to each product using the four activity drivers. 2. Determine the total overhead assigned to each model using the two most expensive activities. The costs of the two relatively inexpensive activities are allocated to the two expensive activities in proportion to their costs. 3. Using ABC as the benchmark, calculate the percentage error and comment on the accuracy of the reduced system. Explain why this approach may be desirable.arrow_forwardYoung Company is beginning operations and is considering three alternatives to allocate manufacturing overhead to individual units produced. Young can use a plantwide rate, departmental rates, or activity-based costing. Young will produce many types of products in its single plant, and not all products will be processed through all departments. In which one of the following independent situations would reported net income for the first year be the same regardless of which overhead allocation method had been selected? a. All production costs approach those costs that were budgeted. b. The sales mix does not vary from the mix that was budgeted. c. All manufacturing overhead is a fixed cost. d. All ending inventory balances are zero.arrow_forward
- Randy Harris, controller, has been given the charge to implement an advanced cost management system. As part of this process, he needs to identify activity drivers for the activities of the firm. During the past four months, Randy has spent considerable effort identifying activities, their associated costs, and possible drivers for the activities costs. Initially, Randy made his selections based on his own judgment using his experience and input from employees who perform the activities. Later, he used regression analysis to confirm his judgment. Randy prefers to use one driver per activity, provided that an R2 of at least 80 percent can be produced. Otherwise, multiple drivers will be used, based on evidence provided by multiple regression analysis. For example, the activity of inspecting finished goods produced an R2 of less than 80 percent for any single activity driver. Randy believes, however, that a satisfactory cost formula can be developed using two activity drivers: the number of batches and the number of inspection hours. Data collected for a 14-month period are as follows: Required: 1. Calculate the cost formula for inspection costs using the two drivers, inspection hours and number of batches. Are both activity drivers useful? What does the R2 indicate about the formula? 2. Using the formula developed in Requirement 1, calculate the inspection cost when 300 inspection hours are used and 30 batches are produced. Prepare a 90 percent confidence interval for this prediction.arrow_forwardBumblebee Mobiles manufactures a line of cell phones. The management has identified the following overhead costs and related cost drivers for the coming year. The following were incurred in manufacturing two of their cell phones, Bubble and Burst, during the first quarter. REQUIREMENT Review the worksheet called ABC that follows these requirements. You have been asked to determine the cost of each product using an activity-based cost system. Note that the problem information is already entered into the Data Section of the ABC worksheet.arrow_forwardThe controller for Muir Companys Salem plant is analyzing overhead in order to determine appropriate drivers for use in flexible budgeting. She decided to concentrate on the past 12 months since that time period was one in which there was little important change in technology, product lines, and so on. Data on overhead costs, number of machine hours, number of setups, and number of purchase orders are in the following table. Required: 1. Calculate an overhead rate based on machine hours using the total overhead cost and total machine hours. (Round the overhead rate to the nearest cent and predicted overhead to the nearest dollar.) Use this rate to predict overhead for each of the 12 months. 2. Run a regression equation using only machine hours as the independent variable. Prepare a flexible budget for overhead for the 12 months using the results of this regression equation. (Round the intercept and x-coefficient to the nearest cent and predicted overhead to the nearest dollar.) Is this flexible budget better than the budget in Requirement 1? Why or why not?arrow_forward
- The company is considering using a two-stage cost allocation system and wants to assess the effects on reported product profits. The company is considering using Engineering Hours and Users as the allocation base. Additional information follows. Toot! TiX Total Engineering hours 7,650 5,650 13,300 Users 9,500 17,100 26,600 Engineering – hour related administrative cost $ 114,380 User-related administrative cost $…arrow_forwardArklan Production is upgrading its manufacturing process from a manual process to a highly automated system. Management believes that the new system will result in greater efficiencies and a better finished product. Arklan is also working on a plan to downsize staff after the implementation of the new system. Arklan has used a traditional absorption costing system to calculate unit product costs for external financial reporting. In the past, Arklan has allocated its manufacturing overhead costs using a predetermined plant-wide overhead rate based on direct labor hours. The controller realizes that the new system may require changing the overhead allocation process. Management plans to take the opportunity to reconsider other improvements to the costing system. Identify and explain three benefits of using departmental overhead rates to allocate overhead costs. Explain the difference between absorption costing and variable costing. Identify which is more suitable for internal…arrow_forwardWarren Furniture produces three models of desk chairs: Basic, Ergo, and Exec. The cost system at the Warren production facility allocates overhead cost on the basis of direct labor hours. The company is considering updating its cost system to an activity-based costing system and is interested in understanding the effects. A study team composed of the production facility's finance and operations groups has identified three overhead cost pools along with appropriate cost drivers for each pool. Cost Pools Assembly Setup Quality assurance Costs $ 2,925,000 1,023,000 642,000 Activity Drivers Direct labor-hours Number of setups Number of tests The plans for production for the next year and the budgeted direct costs and activity by product line are as follows: Direct costs (material and labor) Basic $ 1,006,800 Direct labor-hours 25,200 Products Ergo $ 1,143,000 12,000 Exec $ 868,800 Machine-hours 29,200 17,200 Number of setups Number of tests Number of units produced 48 140 7,200 72 100…arrow_forward
arrow_back_ios
SEE MORE QUESTIONS
arrow_forward_ios
Recommended textbooks for you
- Cornerstones of Cost Management (Cornerstones Ser...AccountingISBN:9781305970663Author:Don R. Hansen, Maryanne M. MowenPublisher:Cengage LearningManagerial AccountingAccountingISBN:9781337912020Author:Carl Warren, Ph.d. Cma William B. TaylerPublisher:South-Western College PubFinancial And Managerial AccountingAccountingISBN:9781337902663Author:WARREN, Carl S.Publisher:Cengage Learning,
- Essentials of Business Analytics (MindTap Course ...StatisticsISBN:9781305627734Author:Jeffrey D. Camm, James J. Cochran, Michael J. Fry, Jeffrey W. Ohlmann, David R. AndersonPublisher:Cengage LearningExcel Applications for Accounting PrinciplesAccountingISBN:9781111581565Author:Gaylord N. SmithPublisher:Cengage Learning
Cornerstones of Cost Management (Cornerstones Ser...
Accounting
ISBN:9781305970663
Author:Don R. Hansen, Maryanne M. Mowen
Publisher:Cengage Learning
Managerial Accounting
Accounting
ISBN:9781337912020
Author:Carl Warren, Ph.d. Cma William B. Tayler
Publisher:South-Western College Pub
Financial And Managerial Accounting
Accounting
ISBN:9781337902663
Author:WARREN, Carl S.
Publisher:Cengage Learning,
Essentials of Business Analytics (MindTap Course ...
Statistics
ISBN:9781305627734
Author:Jeffrey D. Camm, James J. Cochran, Michael J. Fry, Jeffrey W. Ohlmann, David R. Anderson
Publisher:Cengage Learning
Excel Applications for Accounting Principles
Accounting
ISBN:9781111581565
Author:Gaylord N. Smith
Publisher:Cengage Learning
Cost Accounting - Definition, Purpose, Types, How it Works?; Author: WallStreetMojo;https://www.youtube.com/watch?v=AwrwUf8vYEY;License: Standard YouTube License, CC-BY