Concept explainers
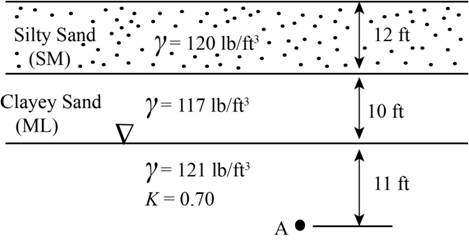
The sub-surface profile at a certain site is shown in Figure 3.20. Compute

Figure 3.20
Soil profile for Problem 3.6.
Learn your wayIncludes step-by-step video

Chapter 3 Solutions
Foundation Design: Principles and Practices (3rd Edition)
Additional Engineering Textbook Solutions
Introduction To Programming Using Visual Basic (11th Edition)
SURVEY OF OPERATING SYSTEMS
Starting Out with Java: From Control Structures through Objects (7th Edition) (What's New in Computer Science)
Database Concepts (8th Edition)
Starting Out with Python (4th Edition)
Starting Out with Java: From Control Structures through Data Structures (4th Edition) (What's New in Computer Science)
- FORWARD FROM POINT B TO POINT A GIVEN THE FOLLOWING: POINT BN=13,163,463.03'E=3,072,129.30' DIRECTION FROM B TO A (NAZ)=276.07529° DISTANCE FROM B TO A = 10.00'arrow_forwardA cheetah is crouched 20 m to the east of an observer. At time t = 0 s, the cheetah begins to run due east toward an antelope that is 50 m to the east of the observer. During the first 2.0 s of the attack, the cheetah's coordinate x varies with time according to the equation x = 20 + 5t?. (a) Find the cheetah's displacement between t1 = 1.0 s and t2 = 2.0 s. (b) Find its average velocity during that interval. (c) Derive an expression for the cheetah's instantaneous velocity as a function of time, and use it to find Vy at t = 1.0 s and t = 2.0 s.arrow_forwardWrite at least 20 words for vocabulary and 10 verbs .for simple present, past, and past participlesarrow_forward
- Can you compute the Panel Board Management while using the Lighting and Power Layout Plan as the base for it? The attached Panel Board Management picture is just an example. ps. not graded, I just want to know how to compute it based on a planarrow_forwardMake Sure the attached pic is correct, because the answer in mannings equation is wrong. Can you design a (Open Channel): -Most Efficient Section (Rectangular Shape) -Cost Estimate -Structural Analysis Design Requirements: Bed Slope= 1:1500 Manning's (n)= 0.015 Discharge: Q= 18 m^3/sarrow_forward2-7 The force P applied at joint D of the square frame causes the frame to sway and form the dashed rhombus. Determine the average normal strain developed in wire AC. Assume the three rods are rigid. I understand how you calculate length LAC its just the sqrt(400^2+400^2) = 565.685mm. I do understand that you have to take LAC'-LAC/LAC to get .0258mm/mm. I'm just not understanding the cosine law used to calculate LAC'. I guess what I'm asking is why do you use cos instead of sin or tangent? I've been trying to understand why that was used for a bit now and it's probably something simple I'm forgetting. If you can, please clarify it in detail. Thank you so much!arrow_forward
- Traffic flow on a three-lane (one direction) freeway can be described by the Greenshields model. One lane of the three lanes on a section of this freeway will have to be closed to undertake an emergency bridge repair that is expected to take 2 hours. It is estimated that the capacity at the work zone will be reduced by 30 percent of that of the section just upstream of the work zone. The mean free flow speed of the highway is 70 mi/h and the jam density is 150 veh/mi/In. If it is estimated that the demand flow on the highway during the emergency repairs is 85 percent of the capacity, using the deterministic approach, determine the following. (a) the maximum queue length (in veh) that will be formed veh (b) the total delay (in h) h (c) the number of vehicles that will be affected by the incident veh (d) the average individual delay (in min) minarrow_forwardNon-constant sections are used in bridges without changing the appearance of the bridge significantly. Refer to the figure below. Compute the ratio of moment inertial after to before of the plate girder shown (greater than 1). A 10x0.5" steel plate of the same grade as the plate girder and is fillet welded to the flangesarrow_forward8-18. Determine the vertical displacement of joint C if member CD is fabricated 10 mm too long. 4m D E B Carrow_forward
- 8-17. Determine the vertical displacement of joint C if members AB and BC experience a temperature increase of ST = 50°C. Take a = 12(10-6)/°C. A 4 m E 4 m 4 m B Darrow_forwardPlease solve all pointsarrow_forwardFor the I section prestressed concrete beam with a straight tendon shown in Fig below which is under the prestressing force, and U.D.L. Analyze the stresses at Mid- span at: A- transfer stage (due to initial prestress P. and self weight wo) B- at service stage. (due to effective prestress Pe and full loads) Check stresses with the ACI permissible stresses. Given: Initial prestress force Pi = 750 kN Effective prestress force Pe = 640 kN Wo (self) = 2.7 kN/m = W (D+L) 8 kN/m e = 130 mm I 5 10 mm² fci = 25 MPa (at transfer age), f' = 35 MPa (at service age) ASECTION 114 000 mm² W=4.75 kN/m |- 12 m F I 610mmarrow_forward
 Fundamentals of Geotechnical Engineering (MindTap...Civil EngineeringISBN:9781305635180Author:Braja M. Das, Nagaratnam SivakuganPublisher:Cengage Learning
 Principles of Foundation Engineering (MindTap Cou...Civil EngineeringISBN:9781305081550Author:Braja M. DasPublisher:Cengage Learning
 Principles of Geotechnical Engineering (MindTap C...Civil EngineeringISBN:9781305970939Author:Braja M. Das, Khaled SobhanPublisher:Cengage Learning
 Principles of Foundation Engineering (MindTap Cou...Civil EngineeringISBN:9781337705028Author:Braja M. Das, Nagaratnam SivakuganPublisher:Cengage Learning


