
Concept explainers
Videos
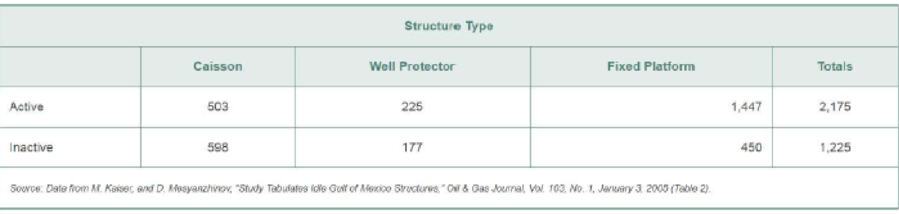
Inactive oil and gas structures. U.S. federal regulations require that operating companies clear all inactive offshore oil and gas structures within 1 year after production ceases. Researchers at the Louisiana State University Center for Energy Studies gathered data on both active and inactive oil and gas structures in the Gulf of Mexico (Oil & Gas Journal, Jan. 3, 2005). They discovered that the Gulf of Mexico has 2,175 active and 1,225 idle (inactive) structures. The following table breaks down these structures by type (caisson, well protector, or fixed platform). Consider the structure type and active status of one of these oil/gas structures.
- a. List the simple
events for this experiment. - b. Assign reasonable probabilities to the simple events.
- c. Find the
probability that the structure is active. - d. Find the probability that the structure is a well protector.
- e. Find the probability that the structure is an inactive caisson.
- f. Find the probability that the structure is either inactive or a fixed platform.
- g. Find the probability that the structure is not a caisson.
Want to see the full answer?
Check out a sample textbook solution
Chapter 3 Solutions
Statistics for Business and Economics (13th Edition)
Additional Math Textbook Solutions
University Calculus: Early Transcendentals (4th Edition)
Elementary and Intermediate Algebra: Concepts and Applications (7th Edition)
Calculus: Early Transcendentals (2nd Edition)
Elementary Statistics ( 3rd International Edition ) Isbn:9781260092561
Beginning and Intermediate Algebra
Elementary & Intermediate Algebra


- Cholesterol Cholesterol in human blood is necessary, but too much can lead to health problems. There are three main types of cholesterol: HDL (high-density lipoproteins), LDL (low-density lipoproteins), and VLDL (very low-density lipoproteins). HDL is considered “good” cholesterol; LDL and VLDL are considered “bad” cholesterol. A standard fasting cholesterol blood test measures total cholesterol, HDL cholesterol, and triglycerides. These numbers are used to estimate LDL and VLDL, which are difficult to measure directly. Your doctor recommends that your combined LDL/VLDL cholesterol level be less than 130 milligrams per deciliter, your HDL cholesterol level be at least 60 milligrams per deciliter, and your total cholesterol level be no more than 200 milligrams per deciliter. (a) Write a system of linear inequalities for the recommended cholesterol levels. Let x represent the HDL cholesterol level, and let y represent the combined LDL VLDL cholesterol level. (b) Graph the system of inequalities from part (a). Label any vertices of the solution region. (c) Is the following set of cholesterol levels within the recommendations? Explain. LDL/VLDL: 120 milligrams per deciliter HDL: 90 milligrams per deciliter Total: 210 milligrams per deciliter (d) Give an example of cholesterol levels in which the LDL/VLDL cholesterol level is too high but the HDL cholesterol level is acceptable. (e) Another recommendation is that the ratio of total cholesterol to HDL cholesterol be less than 4 (that is, less than 4 to 1). Identify a point in the solution region from part (b) that meets this recommendation, and explain why it meets the recommendation.arrow_forwardThe table to the right represents the annual percentage of smartphones sold in a certain region in 2011, 2012, and 2013 (projected). a. What conclusions can you reach about the market for smartphones in 2011, 2012, and 2013? b. What differences are there in the market for smartphones in 2011, 2012, and 2013? Type Type 1 Type 2 Type 3 Type 4 Type 5 Type 6 2011 2012 52% 65% 18% 16% 1% 6% 13% 7% 13% 3% 4% 2% a. Select all that apply. A. Type 3 had the second largest percentage of smartphones sold in all three years. B. Type 2 had the second largest percentage of smartphones sold in all three years. C. Type 6 had the smallest or close to the smallest percentage of smartphones sold in all three years. D. Type 1 had the largest percentage of smartphones sold in all three years. E. Type 5 had the smallest or close to the smallest percentage of smartphones sold in all three years. 2013 54% 20% 18% 4% 2% 2%arrow_forward2. Categorize data Table 1 shows the rental life of 32 components. These values are sorted by order. 432 518 568 622 Table 1: The lifespan in renting components 402 502 542 598 404 504 558 414 508 562 614 444 524 574 462 526 584 642 484 532 586 652 492 538 596 654 602 630 a. Categorize the data in the most appropriate way. Show intermediate steps. Justify how you arrived at your answer. b. Name 4 conditions for categorization.arrow_forward
- 3. The following table represent the number of drivers involved in a fatal crash in 2016 in various light and weather conditions. (Sections 5.1-5.3) Weather Normal Rain Snow/Sleet Other Unknown Light Condition Daylight Dark, but Lighted 12,307 875 219 125 810 Dark 5875 8151 497 681 51 156 54 220 255 548 Dawn/Dusk Other 1183 87 17 40 71 65 8 2 9 133 Source: Fatality Analysis Reporting System. a) Determine the probability that a randomly selected fatal crash occurred in normal weather. Determine the probability that a randomly selected fatal crash occurred in daylight. b) c) Determine the probability that a randomly selected fatal crash occurred in rain or in dark, but lighted. Is this unusual? d) Determine the probability that a randomly selected fatal crash occurred in normal weather or in daylight. e) Would it be unusual for a fatal crash to occur while it is dark and raining? Include all dark conditions.arrow_forwardAll Fresh Seafood is a wholesale fish company based on the east coast of the U.S. Catalina Offshore Products is a wholesale fish company based on the west coast of the U.S. Table #9.2.5 contains prices from both companies for specific fish types ("Seafood online," 2013) ("Buy sushi grade," 2013). Data is in following table: Fish All Fresh Seafood Prices Catalina Offshore Products Prices Cod 19.99 17.99 Tilapi 6.00 13.99 Farmed Salmon 19.99 22.99 Organic Salmon 24.99 24.99 Grouper Fillet 29.99 19.99 Tuna 28.99 31.99 Swordfish 23.99 23.99 Sea Bass 32.99 23.99 Striped Bass 29.99 14.99 Do the data provide enough evidence to show that a west coast fish wholesaler is more expensive than an east coast wholesaler? Test at the 5% level. (vii) Determine degrees of freedom for the sample of differences dfd : Enter value in integer form. Examples of correctly entered answers: 2 5 9 23 77…arrow_forwardIs it possible to predict the annual number of business bankruptcies by the number of firm births (business starts) in the United States? The following data published by the U.S. Small Business Administration, Office of Advocacy, are pairs of the number of business bankruptcies (1,000s) and the number of firm births (10,000s) for a six-year period. Business Bankruptcies (1,000) 34.3 Firm Births (10,000) 58.1 35.0 55.4 38.5 57.0 40.1 58.5 35.5 57.4 37.9 58.0 i) Based on the output given, use these data to develop the equation of the regression model to predict the number of business bankruptcies by the number of firm births. ii) Explain the values of r and r. iii) Predict the number of business bankruptcies if the number of firm births is 54.0 (10,000s). iv) Do the data support the existence of a linear relationship between the number of firm births and the number of business bankruptcies? Test using a = 0.05. OUTPUT Model Summary Std. Error of the Estimate Adusted R Model R R Square…arrow_forward

 Functions and Change: A Modeling Approach to Coll...AlgebraISBN:9781337111348Author:Bruce Crauder, Benny Evans, Alan NoellPublisher:Cengage Learning
 Linear Algebra: A Modern IntroductionAlgebraISBN:9781285463247Author:David PoolePublisher:Cengage Learning
 Glencoe Algebra 1, Student Edition, 9780079039897...AlgebraISBN:9780079039897Author:CarterPublisher:McGraw Hill
 Big Ideas Math A Bridge To Success Algebra 1: Stu...AlgebraISBN:9781680331141Author:HOUGHTON MIFFLIN HARCOURTPublisher:Houghton Mifflin Harcourt