Concept explainers
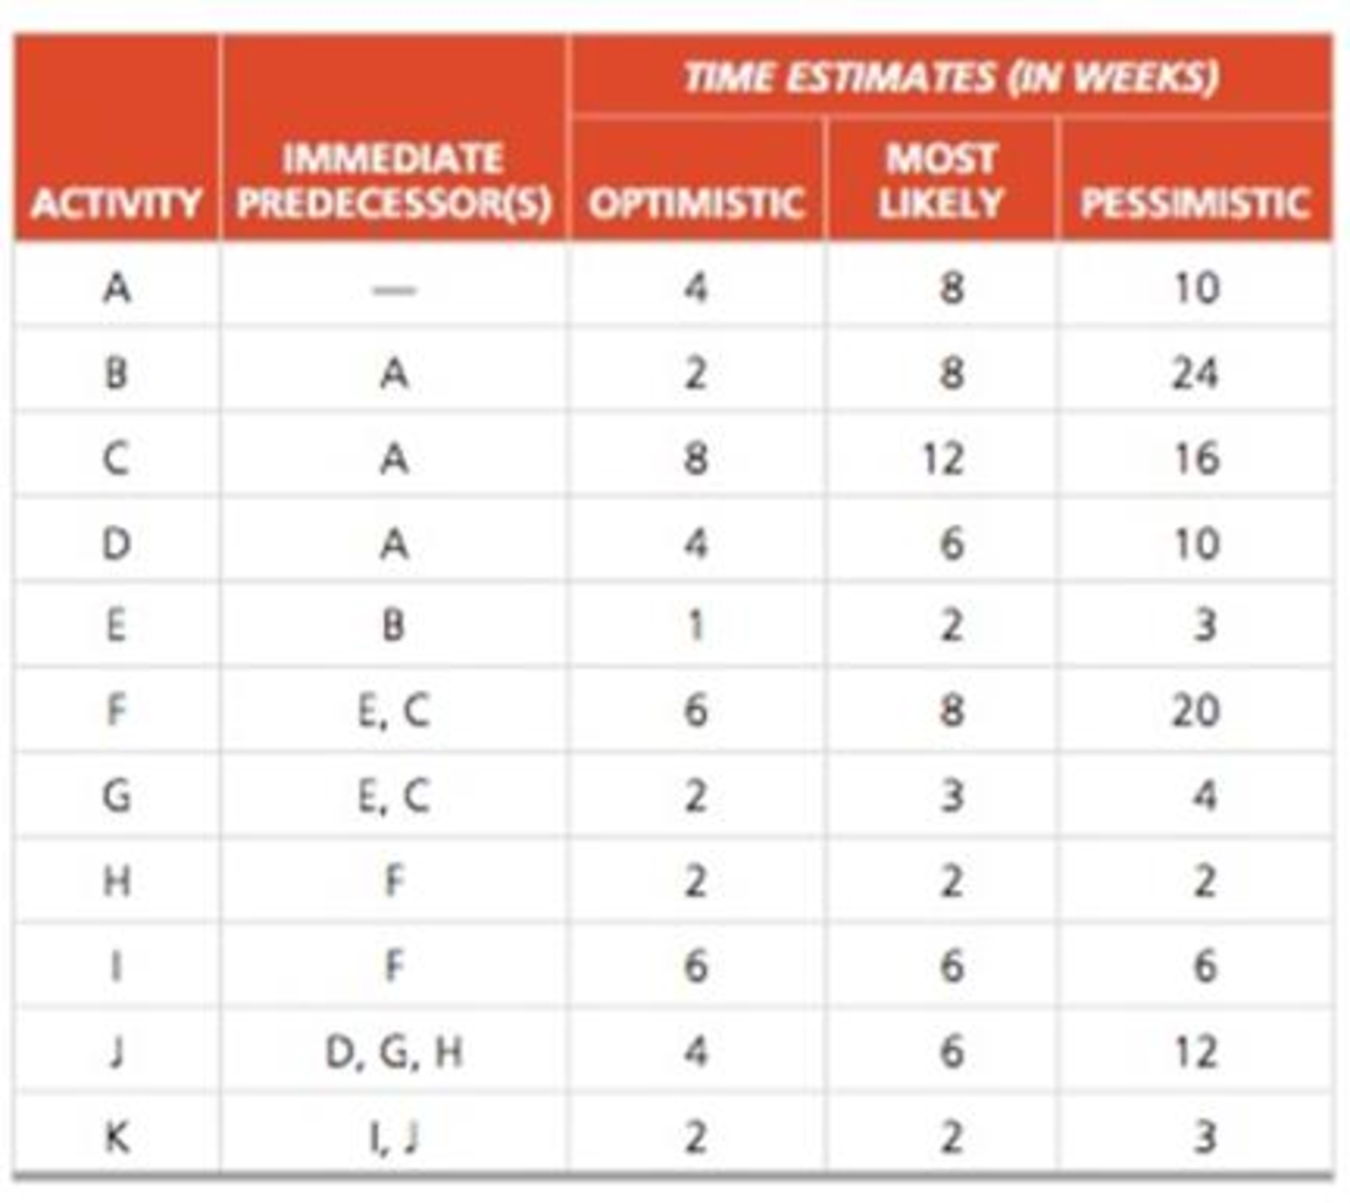
Ross Hopkins, president of Hopkins Hospitality, has developed the tasks, durations, and predecessor relationships in the following table for building new motels. Draw the AON network and answer the questions that follow.

a) What is the expected (estimated) time for activity C?
b) What is the variance for activity C?
c) Based on the calculation of estimated times, what is the critical path?
d) What is the estimated time of the critical path?
e) What is the activity variance along the critical path?
f) What is the probability of completion of the project before week 36?
a)
To determine: The expected time for activity C.
Introduction: In the activity on nodes (AON) project network diagram, the nodes denote activities and the arrows show only the precedence and succession sequence.
Answer to Problem 17P
The expected time for activity C is 12 weeks.
Explanation of Solution
Given information:
| Activity | Immediate predecessor | Time estimates | ||
| Optimistic | Most likely | Pessimistic | ||
| A | 4 | 8 | 10 | |
| B | A | 2 | 8 | 24 |
| C | A | 8 | 12 | 16 |
| D | A | 4 | 6 | 10 |
| E | B | 1 | 2 | 3 |
| F | E,C | 6 | 8 | 20 |
| G | E,C | 2 | 3 | 4 |
| H | F | 2 | 2 | 2 |
| I | F | 6 | 6 | 6 |
| J | D,G,H | 4 | 6 | 12 |
| K | I,J | 2 | 2 | 3 |
Calculation of expected time for activity C:
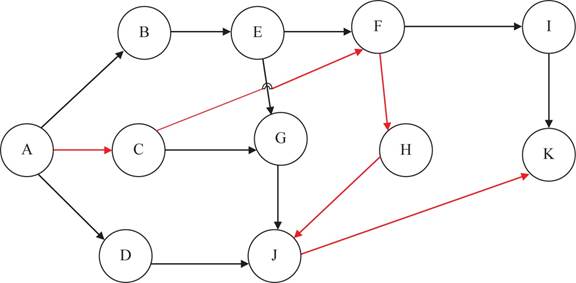
AON project network diagram shown below, given the precedence relationships of various activities,

Figure 1
With the given predecessor AON diagram is constructed. To Calculate the expected time for activity C given the data that the optimistic time estimate “a” of activity C of 8 weeks, the most likely time estimate “m” of 12 weeks and the pessimistic time estimate “b” of 16 weeks using the formula.
Where ‘a’ is the optimistic time estimate, ‘m’ is the most likely time estimate and ‘b’ is the pessimistic time estimate
Substitute into the equation (1), the values of
Therefore the expected time for activity C is calcualted by adding 8, 48 and16 and dividing the sum with 6 which gives
Hence, the expected time for activity C is 12 weeks.
b)
To calculate: The variance for activity C.
Answer to Problem 17P
The variance for activity C is 1.78 weeks.
Explanation of Solution
Given information:
| Activity | Immediate predecessor | Time estimates | ||
| Optimistic | Most likely | Pessimistic | ||
| A | 4 | 8 | 10 | |
| B | A | 2 | 8 | 24 |
| C | A | 8 | 12 | 16 |
| D | A | 4 | 6 | 10 |
| E | B | 1 | 2 | 3 |
| F | E,C | 6 | 8 | 20 |
| G | E,C | 2 | 3 | 4 |
| H | F | 2 | 2 | 2 |
| I | F | 6 | 6 | 6 |
| J | D,G,H | 4 | 6 | 12 |
| K | I,J | 2 | 2 | 3 |
Calculation of variance for activity C:
Calculate the variance for activity C using the formula
Substitute in equation (2) the values of
The variance of activity C is calculated by squaring the value obtained by dividing the difference of 16 and 8 with 6 which gives the resultant as 1.28 weeks.
The variance in activity C is 1.78 weeks.
c)
To determine: The critical path.
Answer to Problem 17P
The critical path AàCàFàHàJàK.
Explanation of Solution
Given information:
| Activity | Immediate predecessor | Time estimates | ||
| Optimistic | Most likely | Pessimistic | ||
| A | 4 | 8 | 10 | |
| B | A | 2 | 8 | 24 |
| C | A | 8 | 12 | 16 |
| D | A | 4 | 6 | 10 |
| E | B | 1 | 2 | 3 |
| F | E,C | 6 | 8 | 20 |
| G | E,C | 2 | 3 | 4 |
| H | F | 2 | 2 | 2 |
| I | F | 6 | 6 | 6 |
| J | D,G,H | 4 | 6 | 12 |
| K | I,J | 2 | 2 | 3 |
Calculation of critical path:
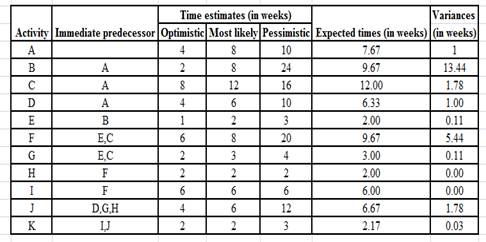
Using equation (1) and (2)calculate the expected times and variances for all the activitiesand obtain the values shown in table.

Figure 1, shows the AON diagram which gives the critical path. The critical path is AàCàFàHàJàK.
Hence, the critical path AàCàFàHàJàK.
d)
To Compute: The estimated time of the critical path.
Answer to Problem 17P
The critical path AàCàFàHàJàK which is 40.18 weeks.
Explanation of Solution
Given information:
| Activity | Immediate predecessor | Time estimates | ||
| Optimistic | Most likely | Pessimistic | ||
| A | 4 | 8 | 10 | |
| B | A | 2 | 8 | 24 |
| C | A | 8 | 12 | 16 |
| D | A | 4 | 6 | 10 |
| E | B | 1 | 2 | 3 |
| F | E,C | 6 | 8 | 20 |
| G | E,C | 2 | 3 | 4 |
| H | F | 2 | 2 | 2 |
| I | F | 6 | 6 | 6 |
| J | D,G,H | 4 | 6 | 12 |
| K | I,J | 2 | 2 | 3 |
Calculation of estimated time of the critical path:
Figure 1, shows the AON diagram which gives the critical path. The critical path is AàCàFàHàJàK.
The various paths and the expected completion times are listed in the table
| Various paths | Completion times |
| AàBàEàFàIàK | 37.18 weeks |
| AàBàEàGàJàK | 31.18 weeks |
| AàCàFàHàJàK | 40.18 weeks |
| AàCàGàJàK | 31.51 weeks |
| AàDàJàK | 22.84 weeks |
Hence, the estimated time of the critical path AàCàFàHàJàK is 40.18 weeks.
e)
To determine: The variance of the critical path.
Answer to Problem 17P
The variance of the critical path is 10.03 weeks.
Explanation of Solution
Given information:
| Activity | Immediate predecessor | Time estimates | ||
| Optimistic | Most likely | Pessimistic | ||
| A | 4 | 8 | 10 | |
| B | A | 2 | 8 | 24 |
| C | A | 8 | 12 | 16 |
| D | A | 4 | 6 | 10 |
| E | B | 1 | 2 | 3 |
| F | E,C | 6 | 8 | 20 |
| G | E,C | 2 | 3 | 4 |
| H | F | 2 | 2 | 2 |
| I | F | 6 | 6 | 6 |
| J | D,G,H | 4 | 6 | 12 |
| K | I,J | 2 | 2 | 3 |
Calculation of variance of the critical path:
The activity variance σ2along the critical path AàCàFàHàJàK is the sum of the variances of individual activities A, C, F, H, J and K.
Therefore,
The activity variance along the critical path is the sum of 1, 1.78, 5.44, 0, 1.78, 0.03 is 10.03 weeks.
Hence, the variance of the critical path is 10.03 weeks
f)
To compute: The probability of completion of the project before week 36 weeks.
Answer to Problem 17P
The probability of completion of the project before week 36 weeks is 9.34%.
Explanation of Solution
Given information:
| Activity | Immediate predecessor | Time estimates | ||
| Optimistic | Most likely | Pessimistic | ||
| A | 4 | 8 | 10 | |
| B | A | 2 | 8 | 24 |
| C | A | 8 | 12 | 16 |
| D | A | 4 | 6 | 10 |
| E | B | 1 | 2 | 3 |
| F | E,C | 6 | 8 | 20 |
| G | E,C | 2 | 3 | 4 |
| H | F | 2 | 2 | 2 |
| I | F | 6 | 6 | 6 |
| J | D,G,H | 4 | 6 | 12 |
| K | I,J | 2 | 2 | 3 |
Calculation of probability of completion of the project before week 36 weeks:
Use the normal distribution tables given that the estimated mean time is 40.18 weeks and the standard deviation is square root of 10.03 weeks.
First compute the standard deviation σ by computing the square root of 10.03 weeks.
Calculate the z value as shown below
For a z value of -1.32, the probability is 9.34%.
Therefore, there is a probability of 9.34% that the project may be completed on or before 36 weeks.
Hence, the probability of completion of the project before week 36 weeks is 9.34%.
Want to see more full solutions like this?
Chapter 3 Solutions
PRIN.OF OPERATIONS MANAGEMENT-MYOMLAB
- Al construction has developed tasks duration and predecessor relationships in the following table for building model houses. The manager has been concerned with the amount of time it took to complete several jobs, some of the company workers are very unreliable. A list of activities and their optimistic completion time, the most likely time and the pessimistic completion time (in days) for a new contract are given in the following table. Activity Predecessors Optimistic (a) Most likely (m) Pessimistic (b) A -- 1 2 3 B - 2 3 4 C A 4 5 6 D B 8 9 10 E C, D 2 5 8 F D 4 5 6 G E 1 2 3 1.Draw the activity network for this new contract (either AON or AOA). 2. Determine the Expected Time and Variance for each activity. 3.. Show the activity schedule (ES, EF, LS, and LF) as well as slack (in table).…arrow_forwardI'm unable to answer the following question? What is the total cost of crashing the project from its current duration down to 13 weeks?arrow_forwardCan anybody draw a network analysis diagram of this problem?arrow_forward
- Table contains information about an environmental cleanup project in the township of Hiles. Shorten the project three weeks by finding the minimum-cost schedule. Assume that project indirect costs and penalty costs are negligible. Identify activities to crash while minimizing the additional crash costs.arrow_forwardThe table below contains information about an environmental clean-up project in the township of Hiles. Shorten the project three weeks by finding the minimum-cost schedule. Assume that project indirect costs and penalty costs are negligible. Identify activities to crash while minimizing the additional crash costs. Q Activity A B C D E The cost of shortening of project is $ F G H I Normal Time (weeks) 5 7 7 7 1 3 5 4 2 Crash Time (weeks) 4 4 Activity A B C D E 6 4 6 1 3 4 2 2 Cost to Crash ($ per week) . (Enter your response as a whole number.) 300 50 300 250 200 200 Fill in the table below with the activity times after crashing to show the resulting schedule. (Enter your responses as whole numbers.) Time according to schedule (weeks) Time according to schedule (weeks) Immediate Predecessor(s) Activity F G H I None None A A B 3~~ C, D D, E F Garrow_forwardDraw the Network Diagram, determine the critical path and draw Gantt chart for project scheduling for the following two problems Problem1. Activity Predeccsor Duration(hours) Lag Time(hours) A - 2 0 B A 4 5 C B 3 3 D B 5 0 E D, C 2 0 Problem 2. Activity Predeccsor Duration(months) A - 2 B A 1 C A 3 D B, C 1 E D 2 F D…arrow_forward
- Consider the following activity description with associated cost data shown in Table 1. The cost data represents the total cost and should be considered linear with time. Table 1: Crash Cost Table Activity Immediate Predecessor Normal Duration (days) Normal Cost ($) Crash Duration (days) Crash Cost ($) A --- 5 50 3 150 B --- 4 40 2 200 C B 7 70 5 250 D A, C 2 20 1 50 E A, C 5 125 1 525 F B 10 80 7 290 G D 7 50 3 250 H E, F 6 60 3 180 Reduce the project duration to minimum duration and calculate the cost. Note:- Do not provide handwritten solution. Maintain accuracy and quality in your answer. Take care of plagiarism. Answer completely. You will get up vote for sure.arrow_forwardThe product development group at “Griffin” Company has already worked on new computer software products that has potential to know a large market share. Via an outside source, London Management has learned that a competitor is working to bring a similar product to market. As a result, London's top management increased its pressure on the product development group. Group leaders have turned to CPM / PERT as an aid to scheduling remaining activities before new products can be brought to market. The estimated time of activity in a day is as follows a.Create the the network if it is accelerated according to the schedule above b.Find the cost and the duration c.Determine the path and critical activitiesarrow_forwardThe product development group at “Griffin” Company has already worked on new computer software products that has potential to know a large market share. Via an outside source, London Management has learned that a competitor is working to bring a similar product to market. As a result, London's top management increased its pressure on the product development group. Group leaders have turned to CPM / PERT as an aid to scheduling remaining activities before new products can be brought to market. The estimated time of activity in a day is as follows Question: Create an initial network Find the cost and the duration Determine the path and critical activitiesarrow_forward
- Draw the PDM network diagram for the following project, calculate the earliest and latest starting and finishing times for all activities, and hence calculate the total float, free float for each activity. Activity IPA Duration (WEEKS) WORKERS REQUIRED PER WEEK EQUIPMENT REQUIRED (hrs/WEEK) H ---- 10 5 8 I H 8 4 2 J H 6 8 6 K J 4 2 1 L J 2 6 2 M J 4 3 2 N I 4 2 0 O I 5 5 0 P I, J 5 6 6 Q L 5 2 0 R M 5 0 4 S N 3 0 4 T Q 3 0 0 U O, S 1 9 8 V K, R 5 14 8 W U 2 6 8 X V 3 6 8 Y P,W,X,T 8 14 8 Z Y 6 5 8 If there is a limit of 15 workers per week, smooth the workers loading using ES and LS histogram. Based on the proposed scheduling, plot the equipment loading histogram for the project. Independently of the above resource leveling, schedule the…arrow_forwardRoger Ginde is developing a program in supply chain management certification for managers. Ginde has listed a num- ber of activities that must be completed before a training program of this nature could be conducted. The activities, immediate pre-decessors, and times appear in the accompanying table: A—2 B—5 C—1 D B 10 E A, D 3 FC6 G E, F 8 A) Develop an AON network for this problem.b) What is the critical path?c) What is the total project completion time? Please answer A B C and show workarrow_forwardConsider the following project network and activity times (in days). E Start Finish D F G Activity | A B C D EF G Time 3 5 6 .2 The crashing data for this project are as follows: Time (days) Cost ($) Activity Normal Crash Normal Crash 800 1,200 2,000 A 2 1,400 В 2 1 1,900 3 2,800 1,500 1,800 2,300 E 6 4 2,800 1,000 1,000 F 2 1 600 G 2 1 500 a. Find the critical path and the expected project completion time. b. What is the total project cost using the normal times? Assume that management desires a 12-day project completion time. c. Formulate a linear programming model that can be used to assist with the crashing decisions. d. What activities should be crashed? e. What is the total project cost for the 12-day completion time? 2.arrow_forward
 Practical Management ScienceOperations ManagementISBN:9781337406659Author:WINSTON, Wayne L.Publisher:Cengage,
 Operations ManagementOperations ManagementISBN:9781259667473Author:William J StevensonPublisher:McGraw-Hill Education
 Operations and Supply Chain Management (Mcgraw-hi...Operations ManagementISBN:9781259666100Author:F. Robert Jacobs, Richard B ChasePublisher:McGraw-Hill Education
 Purchasing and Supply Chain ManagementOperations ManagementISBN:9781285869681Author:Robert M. Monczka, Robert B. Handfield, Larry C. Giunipero, James L. PattersonPublisher:Cengage Learning
 Production and Operations Analysis, Seventh Editi...Operations ManagementISBN:9781478623069Author:Steven Nahmias, Tava Lennon OlsenPublisher:Waveland Press, Inc.


