
Essential Statistics
2nd Edition
ISBN: 9781259570643
Author: Navidi
Publisher: MCG
expand_more
expand_more
format_list_bulleted
Videos
Textbook Question
Chapter 2.4, Problem 13E
College degrees: Both of the following time-series plots present the percentage of U.S. Bachelor degrees that were in science or mathematics during the years 1970 through 2010. (Source: U.S. Department of Education)
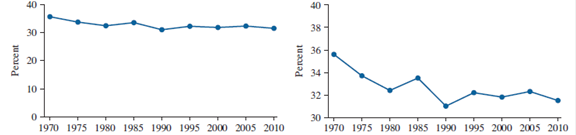
Which of the following statements is more accurate, and why?
- (i) The percentage of degrees that were in science or mathematics decreased considerably between 1970 and 2010.
- (ii) The percentage of degrees that were in science or mathematics decreased somewhat between 1970 and 2010.
Expert Solution & Answer
Want to see the full answer?
Check out a sample textbook solution
Students have asked these similar questions
NC Current Students - North Ce X | NC Canvas Login Links - North ( X
Final Exam Comprehensive x Cengage Learning
x
WASTAT - Final Exam - STAT
→
C
webassign.net/web/Student/Assignment-Responses/submit?dep=36055360&tags=autosave#question3659890_9
Part (b)
Draw a scatter plot of the ordered pairs.
N
Life
Expectancy
Life
Expectancy
80
70
600
50
40
30
20
10
Year of
1950
1970 1990
2010 Birth
O
Life
Expectancy
Part (c)
800
70
60
50
40
30
20
10
1950
1970 1990
W
ALT
林
$
#
4
R
J7
Year of
2010 Birth
F6
4+
80
70
60
50
40
30
20
10
Year of
1950 1970 1990
2010 Birth
Life
Expectancy
Ox
800
70
60
50
40
30
20
10
Year of
1950 1970 1990 2010 Birth
hp
P.B.
KA
&
7
80
% 5
H
A
B
F10
711
N
M
K
744
PRT SC
ALT
CTRL
Harvard University
California Institute of Technology
Massachusetts Institute of Technology
Stanford University
Princeton University
University of Cambridge
University of Oxford
University of California, Berkeley
Imperial College London
Yale University
University of California, Los Angeles
University of Chicago
Johns Hopkins University
Cornell University
ETH Zurich
University of Michigan
University of Toronto
Columbia University
University of Pennsylvania
Carnegie Mellon University
University of Hong Kong
University College London
University of Washington
Duke University
Northwestern University
University of Tokyo
Georgia Institute of Technology
Pohang University of Science and Technology
University of California, Santa Barbara
University of British Columbia
University of North Carolina at Chapel Hill
University of California, San Diego
University of Illinois at Urbana-Champaign
National University of Singapore
McGill…
Name
Harvard University
California Institute of Technology
Massachusetts Institute of Technology
Stanford University
Princeton University
University of Cambridge
University of Oxford
University of California, Berkeley
Imperial College London
Yale University
University of California, Los Angeles
University of Chicago
Johns Hopkins University
Cornell University
ETH Zurich
University of Michigan
University of Toronto
Columbia University
University of Pennsylvania
Carnegie Mellon University
University of Hong Kong
University College London
University of Washington
Duke University
Northwestern University
University of Tokyo
Georgia Institute of Technology
Pohang University of Science and Technology
University of California, Santa Barbara
University of British Columbia
University of North Carolina at Chapel Hill
University of California, San Diego
University of Illinois at Urbana-Champaign
National University of Singapore…
Chapter 2 Solutions
Essential Statistics
Ch. 2.1 - 1. The following table lists the types of aircraft...Ch. 2.1 - Prob. 2CYUCh. 2.1 - Prob. 3CYUCh. 2.1 - Prob. 4CYUCh. 2.1 - Prob. 5ECh. 2.1 - In Exercises 5–8, fill in each blank with the...Ch. 2.1 - Prob. 7ECh. 2.1 -
In Exercises 5–8, fill in each blank with the...Ch. 2.1 - Prob. 9ECh. 2.1 - In Exercises 9–12, determine whether the statement...
Ch. 2.1 - Prob. 11ECh. 2.1 -
In Exercises 9–12, determine whether the...Ch. 2.1 - Prob. 13ECh. 2.1 - 14. The most common blood typing system divides...Ch. 2.1 - 15. Following is a pie chart that presents the...Ch. 2.1 - 16. Student expenses: The following pie chart...Ch. 2.1 - 17. Food sources: The following side-by-side bar...Ch. 2.1 -
18. Super Bowl: The following side-by-side bar...Ch. 2.1 - Prob. 19ECh. 2.1 - 20. Popular video games: The following frequency...Ch. 2.1 - Prob. 21ECh. 2.1 - Prob. 22ECh. 2.1 - Prob. 23ECh. 2.1 - Prob. 24ECh. 2.1 - Prob. 25ECh. 2.1 - 26. How secure is your job? In a survey, employed...Ch. 2.1 - Prob. 27ECh. 2.1 - Prob. 28ECh. 2.1 - Prob. 29ECh. 2.1 - 30. Bought a new car lately? The following table...Ch. 2.1 - Prob. 31ECh. 2.1 - Prob. 32ECh. 2.1 - Prob. 33ECh. 2.1 - Prob. 34ECh. 2.1 - Prob. 35ECh. 2.2 - Using the data in Table 2.7, construct a frequency...Ch. 2.2 - Prob. 2CYUCh. 2.2 - Prob. 3CYUCh. 2.2 - Prob. 4CYUCh. 2.2 - Prob. 5ECh. 2.2 -
In Exercises 5-8, fill in each blank with the...Ch. 2.2 - Prob. 7ECh. 2.2 - Prob. 8ECh. 2.2 - Prob. 9ECh. 2.2 - Prob. 10ECh. 2.2 - Prob. 11ECh. 2.2 - In Exercises 9-12, determine whether the statement...Ch. 2.2 - Prob. 13ECh. 2.2 - In Exercises 13–16, classify the histogram as...Ch. 2.2 - Prob. 15ECh. 2.2 - In Exercises 13–16, classify the histogram as...Ch. 2.2 - In Exercises 17 and 18, classify the histogram as...Ch. 2.2 - In Exercises 17 and 18, classify the histogram as...Ch. 2.2 - Prob. 19ECh. 2.2 - 20. Trained rats: Forty rats were trained to run a...Ch. 2.2 - 21. Interpret histogram: The following histogram...Ch. 2.2 - Prob. 22ECh. 2.2 - Prob. 23ECh. 2.2 - Skewed which way? For which of the following data...Ch. 2.2 - Prob. 25ECh. 2.2 - 26. Batting average: The following frequency...Ch. 2.2 - Prob. 27ECh. 2.2 - 28. Murder, she wrote: The following frequency...Ch. 2.2 - BMW prices: The following table presents the...Ch. 2.2 - Geysers: The geyser Old Faithful in Yellowstone...Ch. 2.2 - Prob. 31ECh. 2.2 - Internet radio: The following table presents the...Ch. 2.2 - Prob. 33ECh. 2.2 - Prob. 34ECh. 2.2 - Prob. 35ECh. 2.2 - Prob. 36ECh. 2.2 - 37. Silver ore: The following histogram presents...Ch. 2.2 - Classes of differing widths: Consider the...Ch. 2.3 - Weights of college students: The following table...Ch. 2.3 - Prob. 2CYUCh. 2.3 - Prob. 3ECh. 2.3 - Prob. 4ECh. 2.3 - In Exercises 3–6, fill in each blank with the...Ch. 2.3 - Prob. 6ECh. 2.3 - Prob. 7ECh. 2.3 - Prob. 8ECh. 2.3 - Prob. 9ECh. 2.3 - Prob. 10ECh. 2.3 - Prob. 11ECh. 2.3 - Prob. 12ECh. 2.3 - Prob. 13ECh. 2.3 - 14. List the data in the following stem-and-leaf...Ch. 2.3 - Prob. 15ECh. 2.3 - Prob. 16ECh. 2.3 - BMW prices: The following table presents the...Ch. 2.3 - How’s the weather? The following table presents...Ch. 2.3 - Prob. 19ECh. 2.3 - Prob. 20ECh. 2.3 - Tennis and golf: Following are the ages of the...Ch. 2.3 - Prob. 22ECh. 2.3 - Prob. 23ECh. 2.3 - 24. Safety first: Following are the numbers of...Ch. 2.3 - Prob. 25ECh. 2.3 - Prob. 26ECh. 2.3 - Prob. 27ECh. 2.3 - Prob. 28ECh. 2.3 - Prob. 29ECh. 2.3 - 30. Going for gold: The following time-series plot...Ch. 2.3 - Prob. 31ECh. 2.3 - Prob. 32ECh. 2.3 - Prob. 33ECh. 2.3 - 34. Arctic ice sheet: The following table presents...Ch. 2.3 - Prob. 35ECh. 2.4 - The population of country A is twice as large as...Ch. 2.4 - Prob. 2CYUCh. 2.4 - Prob. 3ECh. 2.4 - Prob. 4ECh. 2.4 - Prob. 5ECh. 2.4 - Prob. 6ECh. 2.4 - Prob. 7ECh. 2.4 - Prob. 8ECh. 2.4 - Prob. 9ECh. 2.4 - Prob. 10ECh. 2.4 - Prob. 11ECh. 2.4 - Prob. 12ECh. 2.4 - College degrees: Both of the following time-series...Ch. 2.4 - Food expenditures: Both of the following...Ch. 2.4 - Prob. 15ECh. 2 - Prob. 1CQCh. 2 - Prob. 2CQCh. 2 - Prob. 3CQCh. 2 - Prob. 4CQCh. 2 - Prob. 5CQCh. 2 - 6. True or false: A histogram can have more than...Ch. 2 - Prob. 7CQCh. 2 - Prob. 8CQCh. 2 - Prob. 9CQCh. 2 - Prob. 10CQCh. 2 - Prob. 11CQCh. 2 - Prob. 12CQCh. 2 - Prob. 13CQCh. 2 - Prob. 14CQCh. 2 - Prob. 15CQCh. 2 - Prob. 1RECh. 2 - Prob. 2RECh. 2 - Prob. 3RECh. 2 - Prob. 4RECh. 2 - Prob. 5RECh. 2 - Prob. 6RECh. 2 - Prob. 7RECh. 2 - Prob. 8RECh. 2 - Prob. 9RECh. 2 - Prob. 10RECh. 2 - Prob. 11RECh. 2 - Prob. 12RECh. 2 - Prob. 13RECh. 2 - Prob. 14RECh. 2 - Prob. 15RECh. 2 - Prob. 1WAICh. 2 - Prob. 2WAICh. 2 - Prob. 3WAICh. 2 - Prob. 4WAICh. 2 - Prob. 1CSCh. 2 - Prob. 2CSCh. 2 - In the chapter introduction, we presented gas...Ch. 2 - Prob. 4CSCh. 2 - Prob. 5CSCh. 2 - Prob. 6CSCh. 2 - Prob. 7CSCh. 2 - Prob. 8CSCh. 2 - Prob. 9CS
Knowledge Booster


Learn more about
Need a deep-dive on the concept behind this application? Look no further. Learn more about this topic, statistics and related others by exploring similar questions and additional content below.Similar questions
- A company found that the daily sales revenue of its flagship product follows a normal distribution with a mean of $4500 and a standard deviation of $450. The company defines a "high-sales day" that is, any day with sales exceeding $4800. please provide a step by step on how to get the answers in excel Q: What percentage of days can the company expect to have "high-sales days" or sales greater than $4800? Q: What is the sales revenue threshold for the bottom 10% of days? (please note that 10% refers to the probability/area under bell curve towards the lower tail of bell curve) Provide answers in the yellow cellsarrow_forwardFind the critical value for a left-tailed test using the F distribution with a 0.025, degrees of freedom in the numerator=12, and degrees of freedom in the denominator = 50. A portion of the table of critical values of the F-distribution is provided. Click the icon to view the partial table of critical values of the F-distribution. What is the critical value? (Round to two decimal places as needed.)arrow_forwardA retail store manager claims that the average daily sales of the store are $1,500. You aim to test whether the actual average daily sales differ significantly from this claimed value. You can provide your answer by inserting a text box and the answer must include: Null hypothesis, Alternative hypothesis, Show answer (output table/summary table), and Conclusion based on the P value. Showing the calculation is a must. If calculation is missing,so please provide a step by step on the answers Numerical answers in the yellow cellsarrow_forward
arrow_back_ios
SEE MORE QUESTIONS
arrow_forward_ios
Recommended textbooks for you
 Functions and Change: A Modeling Approach to Coll...AlgebraISBN:9781337111348Author:Bruce Crauder, Benny Evans, Alan NoellPublisher:Cengage Learning
 Big Ideas Math A Bridge To Success Algebra 1: Stu...AlgebraISBN:9781680331141Author:HOUGHTON MIFFLIN HARCOURTPublisher:Houghton Mifflin Harcourt
 Glencoe Algebra 1, Student Edition, 9780079039897...AlgebraISBN:9780079039897Author:CarterPublisher:McGraw Hill
 Holt Mcdougal Larson Pre-algebra: Student Edition...AlgebraISBN:9780547587776Author:HOLT MCDOUGALPublisher:HOLT MCDOUGAL
 Linear Algebra: A Modern IntroductionAlgebraISBN:9781285463247Author:David PoolePublisher:Cengage Learning
Functions and Change: A Modeling Approach to Coll...
Algebra
ISBN:9781337111348
Author:Bruce Crauder, Benny Evans, Alan Noell
Publisher:Cengage Learning
Big Ideas Math A Bridge To Success Algebra 1: Stu...
Algebra
ISBN:9781680331141
Author:HOUGHTON MIFFLIN HARCOURT
Publisher:Houghton Mifflin Harcourt
Glencoe Algebra 1, Student Edition, 9780079039897...
Algebra
ISBN:9780079039897
Author:Carter
Publisher:McGraw Hill
Holt Mcdougal Larson Pre-algebra: Student Edition...
Algebra
ISBN:9780547587776
Author:HOLT MCDOUGAL
Publisher:HOLT MCDOUGAL
Linear Algebra: A Modern Introduction
Algebra
ISBN:9781285463247
Author:David Poole
Publisher:Cengage Learning
What Are Research Ethics?; Author: HighSchoolScience101;https://www.youtube.com/watch?v=nX4c3V23DZI;License: Standard YouTube License, CC-BY
What is Ethics in Research - ethics in research (research ethics); Author: Chee-Onn Leong;https://www.youtube.com/watch?v=W8Vk0sXtMGU;License: Standard YouTube License, CC-BY