
Essential Statistics
2nd Edition
ISBN: 9781259570643
Author: Navidi
Publisher: MCG
expand_more
expand_more
format_list_bulleted
Videos
Textbook Question
Chapter 2.2, Problem 1CYU
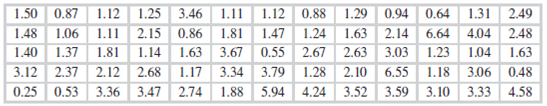
Using the data in Table 2.7, construct a frequency distribution with classes of width 0.5.
Table 2.7 Particulate Emissions for 65 Vehicles
Expert Solution & Answer
Want to see the full answer?
Check out a sample textbook solution
Students have asked these similar questions
A retail store manager claims that the average daily sales of the store are $1,500.
You aim to test whether the actual average daily sales differ significantly from this claimed value.
You can provide your answer by inserting a text box and the answer must include:
Null hypothesis,
Alternative hypothesis,
Show answer (output table/summary table), and
Conclusion based on the P value.
Showing the calculation is a must. If calculation is missing,so please provide a step by step on the answers
Numerical answers in the yellow cells
Show all work
Show all work
Chapter 2 Solutions
Essential Statistics
Ch. 2.1 - 1. The following table lists the types of aircraft...Ch. 2.1 - Prob. 2CYUCh. 2.1 - Prob. 3CYUCh. 2.1 - Prob. 4CYUCh. 2.1 - Prob. 5ECh. 2.1 - In Exercises 5–8, fill in each blank with the...Ch. 2.1 - Prob. 7ECh. 2.1 -
In Exercises 5–8, fill in each blank with the...Ch. 2.1 - Prob. 9ECh. 2.1 - In Exercises 9–12, determine whether the statement...
Ch. 2.1 - Prob. 11ECh. 2.1 -
In Exercises 9–12, determine whether the...Ch. 2.1 - Prob. 13ECh. 2.1 - 14. The most common blood typing system divides...Ch. 2.1 - 15. Following is a pie chart that presents the...Ch. 2.1 - 16. Student expenses: The following pie chart...Ch. 2.1 - 17. Food sources: The following side-by-side bar...Ch. 2.1 -
18. Super Bowl: The following side-by-side bar...Ch. 2.1 - Prob. 19ECh. 2.1 - 20. Popular video games: The following frequency...Ch. 2.1 - Prob. 21ECh. 2.1 - Prob. 22ECh. 2.1 - Prob. 23ECh. 2.1 - Prob. 24ECh. 2.1 - Prob. 25ECh. 2.1 - 26. How secure is your job? In a survey, employed...Ch. 2.1 - Prob. 27ECh. 2.1 - Prob. 28ECh. 2.1 - Prob. 29ECh. 2.1 - 30. Bought a new car lately? The following table...Ch. 2.1 - Prob. 31ECh. 2.1 - Prob. 32ECh. 2.1 - Prob. 33ECh. 2.1 - Prob. 34ECh. 2.1 - Prob. 35ECh. 2.2 - Using the data in Table 2.7, construct a frequency...Ch. 2.2 - Prob. 2CYUCh. 2.2 - Prob. 3CYUCh. 2.2 - Prob. 4CYUCh. 2.2 - Prob. 5ECh. 2.2 -
In Exercises 5-8, fill in each blank with the...Ch. 2.2 - Prob. 7ECh. 2.2 - Prob. 8ECh. 2.2 - Prob. 9ECh. 2.2 - Prob. 10ECh. 2.2 - Prob. 11ECh. 2.2 - In Exercises 9-12, determine whether the statement...Ch. 2.2 - Prob. 13ECh. 2.2 - In Exercises 13–16, classify the histogram as...Ch. 2.2 - Prob. 15ECh. 2.2 - In Exercises 13–16, classify the histogram as...Ch. 2.2 - In Exercises 17 and 18, classify the histogram as...Ch. 2.2 - In Exercises 17 and 18, classify the histogram as...Ch. 2.2 - Prob. 19ECh. 2.2 - 20. Trained rats: Forty rats were trained to run a...Ch. 2.2 - 21. Interpret histogram: The following histogram...Ch. 2.2 - Prob. 22ECh. 2.2 - Prob. 23ECh. 2.2 - Skewed which way? For which of the following data...Ch. 2.2 - Prob. 25ECh. 2.2 - 26. Batting average: The following frequency...Ch. 2.2 - Prob. 27ECh. 2.2 - 28. Murder, she wrote: The following frequency...Ch. 2.2 - BMW prices: The following table presents the...Ch. 2.2 - Geysers: The geyser Old Faithful in Yellowstone...Ch. 2.2 - Prob. 31ECh. 2.2 - Internet radio: The following table presents the...Ch. 2.2 - Prob. 33ECh. 2.2 - Prob. 34ECh. 2.2 - Prob. 35ECh. 2.2 - Prob. 36ECh. 2.2 - 37. Silver ore: The following histogram presents...Ch. 2.2 - Classes of differing widths: Consider the...Ch. 2.3 - Weights of college students: The following table...Ch. 2.3 - Prob. 2CYUCh. 2.3 - Prob. 3ECh. 2.3 - Prob. 4ECh. 2.3 - In Exercises 3–6, fill in each blank with the...Ch. 2.3 - Prob. 6ECh. 2.3 - Prob. 7ECh. 2.3 - Prob. 8ECh. 2.3 - Prob. 9ECh. 2.3 - Prob. 10ECh. 2.3 - Prob. 11ECh. 2.3 - Prob. 12ECh. 2.3 - Prob. 13ECh. 2.3 - 14. List the data in the following stem-and-leaf...Ch. 2.3 - Prob. 15ECh. 2.3 - Prob. 16ECh. 2.3 - BMW prices: The following table presents the...Ch. 2.3 - How’s the weather? The following table presents...Ch. 2.3 - Prob. 19ECh. 2.3 - Prob. 20ECh. 2.3 - Tennis and golf: Following are the ages of the...Ch. 2.3 - Prob. 22ECh. 2.3 - Prob. 23ECh. 2.3 - 24. Safety first: Following are the numbers of...Ch. 2.3 - Prob. 25ECh. 2.3 - Prob. 26ECh. 2.3 - Prob. 27ECh. 2.3 - Prob. 28ECh. 2.3 - Prob. 29ECh. 2.3 - 30. Going for gold: The following time-series plot...Ch. 2.3 - Prob. 31ECh. 2.3 - Prob. 32ECh. 2.3 - Prob. 33ECh. 2.3 - 34. Arctic ice sheet: The following table presents...Ch. 2.3 - Prob. 35ECh. 2.4 - The population of country A is twice as large as...Ch. 2.4 - Prob. 2CYUCh. 2.4 - Prob. 3ECh. 2.4 - Prob. 4ECh. 2.4 - Prob. 5ECh. 2.4 - Prob. 6ECh. 2.4 - Prob. 7ECh. 2.4 - Prob. 8ECh. 2.4 - Prob. 9ECh. 2.4 - Prob. 10ECh. 2.4 - Prob. 11ECh. 2.4 - Prob. 12ECh. 2.4 - College degrees: Both of the following time-series...Ch. 2.4 - Food expenditures: Both of the following...Ch. 2.4 - Prob. 15ECh. 2 - Prob. 1CQCh. 2 - Prob. 2CQCh. 2 - Prob. 3CQCh. 2 - Prob. 4CQCh. 2 - Prob. 5CQCh. 2 - 6. True or false: A histogram can have more than...Ch. 2 - Prob. 7CQCh. 2 - Prob. 8CQCh. 2 - Prob. 9CQCh. 2 - Prob. 10CQCh. 2 - Prob. 11CQCh. 2 - Prob. 12CQCh. 2 - Prob. 13CQCh. 2 - Prob. 14CQCh. 2 - Prob. 15CQCh. 2 - Prob. 1RECh. 2 - Prob. 2RECh. 2 - Prob. 3RECh. 2 - Prob. 4RECh. 2 - Prob. 5RECh. 2 - Prob. 6RECh. 2 - Prob. 7RECh. 2 - Prob. 8RECh. 2 - Prob. 9RECh. 2 - Prob. 10RECh. 2 - Prob. 11RECh. 2 - Prob. 12RECh. 2 - Prob. 13RECh. 2 - Prob. 14RECh. 2 - Prob. 15RECh. 2 - Prob. 1WAICh. 2 - Prob. 2WAICh. 2 - Prob. 3WAICh. 2 - Prob. 4WAICh. 2 - Prob. 1CSCh. 2 - Prob. 2CSCh. 2 - In the chapter introduction, we presented gas...Ch. 2 - Prob. 4CSCh. 2 - Prob. 5CSCh. 2 - Prob. 6CSCh. 2 - Prob. 7CSCh. 2 - Prob. 8CSCh. 2 - Prob. 9CS
Knowledge Booster


Learn more about
Need a deep-dive on the concept behind this application? Look no further. Learn more about this topic, statistics and related others by exploring similar questions and additional content below.Similar questions
- please find the answers for the yellows boxes using the information and the picture belowarrow_forwardA marketing agency wants to determine whether different advertising platforms generate significantly different levels of customer engagement. The agency measures the average number of daily clicks on ads for three platforms: Social Media, Search Engines, and Email Campaigns. The agency collects data on daily clicks for each platform over a 10-day period and wants to test whether there is a statistically significant difference in the mean number of daily clicks among these platforms. Conduct ANOVA test. You can provide your answer by inserting a text box and the answer must include: also please provide a step by on getting the answers in excel Null hypothesis, Alternative hypothesis, Show answer (output table/summary table), and Conclusion based on the P value.arrow_forwardA company found that the daily sales revenue of its flagship product follows a normal distribution with a mean of $4500 and a standard deviation of $450. The company defines a "high-sales day" that is, any day with sales exceeding $4800. please provide a step by step on how to get the answers Q: What percentage of days can the company expect to have "high-sales days" or sales greater than $4800? Q: What is the sales revenue threshold for the bottom 10% of days? (please note that 10% refers to the probability/area under bell curve towards the lower tail of bell curve) Provide answers in the yellow cellsarrow_forward
- Business Discussarrow_forwardThe following data represent total ventilation measured in liters of air per minute per square meter of body area for two independent (and randomly chosen) samples. Analyze these data using the appropriate non-parametric hypothesis testarrow_forwardeach column represents before & after measurements on the same individual. Analyze with the appropriate non-parametric hypothesis test for a paired design.arrow_forward
arrow_back_ios
SEE MORE QUESTIONS
arrow_forward_ios
Recommended textbooks for you
 Holt Mcdougal Larson Pre-algebra: Student Edition...AlgebraISBN:9780547587776Author:HOLT MCDOUGALPublisher:HOLT MCDOUGAL
 Glencoe Algebra 1, Student Edition, 9780079039897...AlgebraISBN:9780079039897Author:CarterPublisher:McGraw Hill
 Big Ideas Math A Bridge To Success Algebra 1: Stu...AlgebraISBN:9781680331141Author:HOUGHTON MIFFLIN HARCOURTPublisher:Houghton Mifflin Harcourt
 College Algebra (MindTap Course List)AlgebraISBN:9781305652231Author:R. David Gustafson, Jeff HughesPublisher:Cengage Learning
 Trigonometry (MindTap Course List)TrigonometryISBN:9781337278461Author:Ron LarsonPublisher:Cengage Learning
Holt Mcdougal Larson Pre-algebra: Student Edition...
Algebra
ISBN:9780547587776
Author:HOLT MCDOUGAL
Publisher:HOLT MCDOUGAL
Glencoe Algebra 1, Student Edition, 9780079039897...
Algebra
ISBN:9780079039897
Author:Carter
Publisher:McGraw Hill
Big Ideas Math A Bridge To Success Algebra 1: Stu...
Algebra
ISBN:9781680331141
Author:HOUGHTON MIFFLIN HARCOURT
Publisher:Houghton Mifflin Harcourt
College Algebra (MindTap Course List)
Algebra
ISBN:9781305652231
Author:R. David Gustafson, Jeff Hughes
Publisher:Cengage Learning
Trigonometry (MindTap Course List)
Trigonometry
ISBN:9781337278461
Author:Ron Larson
Publisher:Cengage Learning
How to make Frequency Distribution Table / Tally Marks and Frequency Distribution Table; Author: Reenu Math;https://www.youtube.com/watch?v=i_A6RiE8tLE;License: Standard YouTube License, CC-BY
Frequency distribution table in statistics; Author: Math and Science;https://www.youtube.com/watch?v=T7KYO76DoOE;License: Standard YouTube License, CC-BY
Frequency Distribution Table for Grouped/Continuous data | Math Dot Com; Author: Maths dotcom;https://www.youtube.com/watch?v=ErnccbXQOPY;License: Standard Youtube License