
Videos
Price-demand. A company manufactures memory chips for microcomputers. Its marketing research department, using statistical techniques, collected the data shown in Table
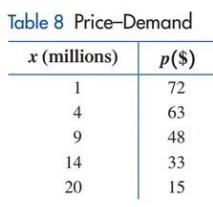
(a) Plot the data points in Table
(b) What would be the estimated price per chip for a demand of
Want to see the full answer?
Check out a sample textbook solution
Chapter 2 Solutions
Finite Mathematics for Business, Economics, Life Sciences and Social Sciences
Additional Math Textbook Solutions
Thinking Mathematically (6th Edition)
A Problem Solving Approach To Mathematics For Elementary School Teachers (13th Edition)
Thinking Mathematically (7th Edition)
Mathematics with Applications In the Management, Natural, and Social Sciences (12th Edition)
Calculus Volume 1
Finite Mathematics & Its Applications (12th Edition)


- Does Table 1 represent a linear function? If so, finda linear equation that models the data.arrow_forwardFor the revenue model in Exercise 10.206 and Exercise 10.210, explain what the x-intercepts mean to the backpack retailer.arrow_forwardFor the revenue model in Exercise 10.205 and Exercise 10.209, explain what the x-intercepts mean to the computer store owner.arrow_forward
- (a) Make a scatter diagram of the data. (b) Use the regression feature of a calculator to find the best-fitting linear function for the data. Graph the function with the data. (c) Repeat part (b) for a cubic function. (d) Estimate the minimum sight distance for a car traveling 68 mph using the functions from parts (b) and (c). (e) By comparing the graphs of the functions in parts (b) and (c) with the data, decide which function best fits the given data.arrow_forwardThe managing director of a consulting group has the accompanying monthly data on total overhead costs and professional labor hours to bill to clients. Complete parts a through c. E Click the icon to view the monthly data. a. Develop a simple linear regression model between billable hours and overhead costs. Overhead Costs = 5304.4 + (0.0219) × Billable Hours +1 (Round the constant to one decimal place as needed. Round the coefficient to four decimal places as needed. Do not include the $ symbol in your answers.) Monthly overhead costs and billable hours data Overhead Costs Billable Hours O IT $385,000 3,000 $430,000 4,000 $460,000 5,000 $511,000 6,000 $580,000 7,000 $600,000 8,000 Print Donearrow_forwardnational homebuildet builds single-family homes and condominium-style townhouses. The accompanying dataset provides information on the selling price. Lot cost, and type of home for closings during one month. (See picture) A. Develop a multiple model for sales price as a function of lot cost and type of home without any interaction term. Create a dummy variable named "townhouse", where it is equal to 1 ehn type= "townhouse" and 0 otherwise. Determine the coefficients of the regression equation. Sale price = __ + (__) • Lot cost + (__) • townhouse. (Round the consant and coefficient of townhouse to the nearest intergar as needed. Round all other values to two decimal places as needed). close Get live help whenever you need from online tutors!Try bartleby tutor todayarrow_forward Oh no! Our expert couldn't answer your question. Don't worry! We won't leave you hanging. Plus, we're giving you back one question for the inconvenience. Here's what the expert had to…arrow_forward
- The market research department of a soft drink manufacturer is investigating the effectiveness of a price discount coupon on the purchase of a two-liter beverage product. A sample of 5500 customers was given coupons for varying-price discounts between 5 and 25 cents. The response variable was the number of coupons in each price discount category redeemed after one month. The data is in the picture. a. Draw a graph of this new model on the same plot that you prepared in part c. Does the expanded model visually provide a better fit to the data than the original model from part a? b. For the quadratic model in part d, find Wald statistics for each individual model parameter. c. Find approximate 95% confidence intervals on the model parameters for the quadratic logistic regression model from part d.arrow_forwardIn linear regression analysis, the coefficient for the x-variable when the y-variable is regressed on the x-variable can be thought of as: Note: more than one answer may be correct Group of answer choices How much the value of the predicted y-variable will change when the x-variable changes by one unit. In the simple (two variable) linear regression model, the coefficient can be thought as the slope coefficient that measures the responsiveness of y to changes in x. The estimated coefficient will change if the sample containing x and y changes. The sample coefficient is an estimate of the population coefficient Before interpreting the coefficient for the x-variable, we should test whether the coefficient is statistically significant.arrow_forwardThe managing director of a consulting group has the accompanying monthly data on total overhead costs and professional labor hours to bill to clients. Complete parts a through c Click the icon to view the monthly data. a. Develop a simple linear regression model between billable hours and overhead costs. Overhead Costs = 247733.3 +(43.2000) x Billable Hours (Round the constant to one decimal place as needed. Round the coefficient to four decimal places as needed. Do not include the $ symbol in your answers.) b. Interpret the coefficients of your regression model. Specifically, what does the fixed component of the model mean to the consulting firm? Interpret the fixed term, bo. if appropriate. Choose the correct answer below. OA. The value of by is the predicted overhead costs for 0 billable hours. OB. For each increase of 1 unit in overhead costs, the predicted billable hours are estimated to increase by bo OC. It is not appropriate to interpret by. because its value is the predicted…arrow_forward

 Algebra & Trigonometry with Analytic GeometryAlgebraISBN:9781133382119Author:SwokowskiPublisher:Cengage
 College Algebra (MindTap Course List)AlgebraISBN:9781305652231Author:R. David Gustafson, Jeff HughesPublisher:Cengage Learning
 Algebra for College StudentsAlgebraISBN:9781285195780Author:Jerome E. Kaufmann, Karen L. SchwittersPublisher:Cengage Learning
 Glencoe Algebra 1, Student Edition, 9780079039897...AlgebraISBN:9780079039897Author:CarterPublisher:McGraw Hill
 Trigonometry (MindTap Course List)TrigonometryISBN:9781337278461Author:Ron LarsonPublisher:Cengage Learning