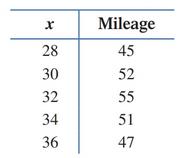
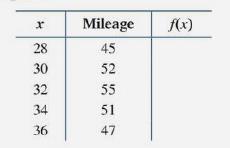
Tire mileage: An automobile tire manufacturer collected the data in the table relating tire pressure x (in pounds per square inch) and mileage (in thousands of miles) A mathematical model for the data is given by f x = − 0.518 x 2 + 33.3 x − 481 (A) Complete the following table. Round values of f x to one decimal place (B) Sketch the graph of f and the mileage data in the same coordinate system . (C) Use the modeling function f x to estimate the mileage for a tire pressure of 31 lbs/sq in . and for 35 lbs/sq in . Round answers to two decimal places. (D) Write a brief description of the relationship between tire pressure and mileage.
Tire mileage: An automobile tire manufacturer collected the data in the table relating tire pressure x (in pounds per square inch) and mileage (in thousands of miles) A mathematical model for the data is given by f x = − 0.518 x 2 + 33.3 x − 481 (A) Complete the following table. Round values of f x to one decimal place (B) Sketch the graph of f and the mileage data in the same coordinate system . (C) Use the modeling function f x to estimate the mileage for a tire pressure of 31 lbs/sq in . and for 35 lbs/sq in . Round answers to two decimal places. (D) Write a brief description of the relationship between tire pressure and mileage.
Tire mileage: An automobile tire manufacturer collected the data in the table relating tire pressure
x
(in pounds per square inch) and mileage (in thousands of miles)
A mathematical model for the data is given by
f
x
=
−
0.518
x
2
+
33.3
x
−
481
(A) Complete the following table. Round values of
f
x
to one decimal place
(B) Sketch the graph of
f
and the mileage data in the same coordinate system.
(C) Use the modeling function
f
x
to estimate the mileage for a tire pressure of
31
lbs/sq
in
.
and for
35
lbs/sq
in
.
Round answers to two decimal places.
(D) Write a brief description of the relationship between tire pressure and mileage.
System that uses coordinates to uniquely determine the position of points. The most common coordinate system is the Cartesian system, where points are given by distance along a horizontal x-axis and vertical y-axis from the origin. A polar coordinate system locates a point by its direction relative to a reference direction and its distance from a given point. In three dimensions, it leads to cylindrical and spherical coordinates.
Consider a sample with data values of 27, 25, 20, 15, 30, 34, 28, and 25. Compute the range, interquartile range, variance, and standard deviation (to a maximum of 2 decimals, if decimals are necessary).
Range
Interquartile range
Variance
Standard deviation
Could you explain this using the formula I attached and polar coorindates
1: Stanley Smothers receives tips from customers as a standard component of his weekly pay. He was paid $5.10/hour by his employer and received $305 in tips during the
most recent 41-hour workweek.
Gross Pay = $
2: Arnold Weiner receives tips from customers as a standard component of his weekly pay. He was paid $4.40/hour by his employer and received $188 in tips during the
most recent 47-hour workweek.
Gross Pay = $
3: Katherine Shaw receives tips from customers as a standard component of her weekly pay. She was paid $2.20/hour by her employer and received $553 in tips during the
most recent 56-hour workweek.
Gross Pay = $
4: Tracey Houseman receives tips from customers as a standard component of her weekly pay. She was paid $3.90/hour by her employer and received $472 in tips during
the most recent 45-hour workweek.
Gross Pay = $
Chapter 2 Solutions
Finite Mathematics for Business, Economics, Life Sciences and Social Sciences
Need a deep-dive on the concept behind this application? Look no further. Learn more about this topic, subject and related others by exploring similar questions and additional content below.
Linear Equation | Solving Linear Equations | What is Linear Equation in one variable ?; Author: Najam Academy;https://www.youtube.com/watch?v=tHm3X_Ta_iE;License: Standard YouTube License, CC-BY


 Algebra & Trigonometry with Analytic GeometryAlgebraISBN:9781133382119Author:SwokowskiPublisher:Cengage
 Glencoe Algebra 1, Student Edition, 9780079039897...AlgebraISBN:9780079039897Author:CarterPublisher:McGraw Hill
 Algebra: Structure And Method, Book 1AlgebraISBN:9780395977224Author:Richard G. Brown, Mary P. Dolciani, Robert H. Sorgenfrey, William L. ColePublisher:McDougal Littell
 Functions and Change: A Modeling Approach to Coll...AlgebraISBN:9781337111348Author:Bruce Crauder, Benny Evans, Alan NoellPublisher:Cengage Learning