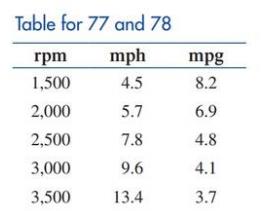
Outboard motors. The table gives performance data for a boat powered by an Evinrude outboard motor. Find a quadratic regression model y = a x 2 + b x + c for fuel consumption y (in miles per gallon) as a function of engine speed (in revolutions per minute). Estimate the fuel consumption at an engine speed of 2 , 300 revolutions per minute.
Outboard motors. The table gives performance data for a boat powered by an Evinrude outboard motor. Find a quadratic regression model y = a x 2 + b x + c for fuel consumption y (in miles per gallon) as a function of engine speed (in revolutions per minute). Estimate the fuel consumption at an engine speed of 2 , 300 revolutions per minute.
Solution Summary: The author explains the quadratic regression model, y=ax2+bx+c, for fuel consumption as a function of engine speed (in revolutions per minute).
Outboard motors. The table gives performance data for a boat powered by an Evinrude outboard motor. Find a quadratic regression model
y
=
a
x
2
+
b
x
+
c
for fuel consumption
y
(in miles per gallon) as a function of engine speed (in revolutions per minute). Estimate the fuel consumption at an engine speed of
2
,
300
revolutions per minute.
Consider a sample with data values of 27, 25, 20, 15, 30, 34, 28, and 25. Compute the range, interquartile range, variance, and standard deviation (to a maximum of 2 decimals, if decimals are necessary).
Range
Interquartile range
Variance
Standard deviation
Could you explain this using the formula I attached and polar coorindates
1: Stanley Smothers receives tips from customers as a standard component of his weekly pay. He was paid $5.10/hour by his employer and received $305 in tips during the
most recent 41-hour workweek.
Gross Pay = $
2: Arnold Weiner receives tips from customers as a standard component of his weekly pay. He was paid $4.40/hour by his employer and received $188 in tips during the
most recent 47-hour workweek.
Gross Pay = $
3: Katherine Shaw receives tips from customers as a standard component of her weekly pay. She was paid $2.20/hour by her employer and received $553 in tips during the
most recent 56-hour workweek.
Gross Pay = $
4: Tracey Houseman receives tips from customers as a standard component of her weekly pay. She was paid $3.90/hour by her employer and received $472 in tips during
the most recent 45-hour workweek.
Gross Pay = $
Chapter 2 Solutions
Finite Mathematics for Business, Economics, Life Sciences and Social Sciences
Need a deep-dive on the concept behind this application? Look no further. Learn more about this topic, subject and related others by exploring similar questions and additional content below.
Correlation Vs Regression: Difference Between them with definition & Comparison Chart; Author: Key Differences;https://www.youtube.com/watch?v=Ou2QGSJVd0U;License: Standard YouTube License, CC-BY
Correlation and Regression: Concepts with Illustrative examples; Author: LEARN & APPLY : Lean and Six Sigma;https://www.youtube.com/watch?v=xTpHD5WLuoA;License: Standard YouTube License, CC-BY


 College Algebra (MindTap Course List)AlgebraISBN:9781305652231Author:R. David Gustafson, Jeff HughesPublisher:Cengage Learning
 Algebra & Trigonometry with Analytic GeometryAlgebraISBN:9781133382119Author:SwokowskiPublisher:Cengage
 College AlgebraAlgebraISBN:9781305115545Author:James Stewart, Lothar Redlin, Saleem WatsonPublisher:Cengage Learning
 Algebra and Trigonometry (MindTap Course List)AlgebraISBN:9781305071742Author:James Stewart, Lothar Redlin, Saleem WatsonPublisher:Cengage Learning
 Glencoe Algebra 1, Student Edition, 9780079039897...AlgebraISBN:9780079039897Author:CarterPublisher:McGraw Hill