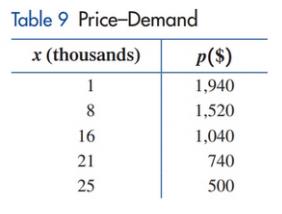
Price-demand. A company manufactures notebook computers. Its marketing research department, using statistical techniques, collected the data shown in Table 9 , where p is the wholesale price per computer at which x thousand computers can be sold. Using special analytical techniques ( regression analysis ), an analyst produced the following price-demand function to model the data: p x = 2000 − 60 x 1 ≤ x ≤ 25 (a) Plot the data points in Table 9 , and sketch a graph of the price-demand function in the same coordinate system . (b) What would be the estimated price per computer for a demand of 11 , 000 computers? For a demand of 18 , 000 computers?
Price-demand. A company manufactures notebook computers. Its marketing research department, using statistical techniques, collected the data shown in Table 9 , where p is the wholesale price per computer at which x thousand computers can be sold. Using special analytical techniques ( regression analysis ), an analyst produced the following price-demand function to model the data: p x = 2000 − 60 x 1 ≤ x ≤ 25 (a) Plot the data points in Table 9 , and sketch a graph of the price-demand function in the same coordinate system . (b) What would be the estimated price per computer for a demand of 11 , 000 computers? For a demand of 18 , 000 computers?
Price-demand. A company manufactures notebook computers. Its marketing research department, using statistical techniques, collected the data shown in Table
9
, where
p
is the wholesale price per computer at which
x
thousand computers can be sold. Using special analytical techniques (regression analysis), an analyst produced the following price-demand function to model the data:
p
x
=
2000
−
60
x
1
≤
x
≤
25
(a) Plot the data points in Table
9
, and sketch a graph of the price-demand function in the same coordinate system.
(b) What would be the estimated price per computer for a demand of
11
,
000
computers? For a demand of
18
,
000
computers?
Definition Definition Statistical method that estimates the relationship between a dependent variable and one or more independent variables. In regression analysis, dependent variables are called outcome variables and independent variables are called predictors.
A Problem Solving Approach To Mathematics For Elementary School Teachers (13th Edition)
Knowledge Booster
Learn more about
Need a deep-dive on the concept behind this application? Look no further. Learn more about this topic, subject and related others by exploring similar questions and additional content below.
Time Series Analysis Theory & Uni-variate Forecasting Techniques; Author: Analytics University;https://www.youtube.com/watch?v=_X5q9FYLGxM;License: Standard YouTube License, CC-BY


 Algebra & Trigonometry with Analytic GeometryAlgebraISBN:9781133382119Author:SwokowskiPublisher:Cengage
 Functions and Change: A Modeling Approach to Coll...AlgebraISBN:9781337111348Author:Bruce Crauder, Benny Evans, Alan NoellPublisher:Cengage Learning
 Glencoe Algebra 1, Student Edition, 9780079039897...AlgebraISBN:9780079039897Author:CarterPublisher:McGraw Hill
 Elementary AlgebraAlgebraISBN:9780998625713Author:Lynn Marecek, MaryAnne Anthony-SmithPublisher:OpenStax - Rice University
 College AlgebraAlgebraISBN:9781305115545Author:James Stewart, Lothar Redlin, Saleem WatsonPublisher:Cengage Learning