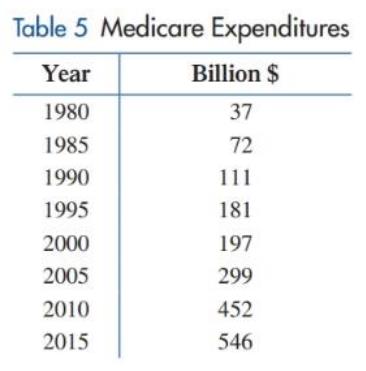
Problem 1RE: In Problems 1-3, use point-by-point plotting to sketch the graph of each equation. y=5x2 Problem 2RE: In Problems 1-3, use point-by-point plotting to sketch the graph of each equation. x2=y2 Problem 3RE: In Problems 1-3, use point-by-point plotting to sketch the graph of each equation. y2=4x2 Problem 4RE: Indicate whether each graph specifies a function: Problem 5RE: For fx=2x1 and gx=x22x, find: (a) f2+g1 (b) f0g4 (c) g2f3 (d) f3g2 Problem 6RE: Write in logarithmic form using base e:u=eu. Problem 7RE: Write in logarithmic form using base 10:x=10y. Problem 8RE: Write in exponential form using base e:lnM=N. Problem 9RE: Write in exponential form using base 10:logu=v. Problem 10RE: Solve Problems for exactly without using a calculator. Problem 11RE: Solve Problems 10-12 for x exactly without using a calculator. logx36=2 Problem 12RE: Solve Problems 10-12 for x exactly without using a calculator. log216=x Problem 13RE: Solve Problems 13-16 for x to three decimal places. 10x=143.7 Problem 14RE: Solve Problems 13-16 for x to three decimal places. ex=503,000 Problem 15RE: Solve Problems 13-16 for x to three decimal places. logx=3.105 Problem 16RE: Solve Problems 13-16 for x to three decimal places. lnx=1.147 Problem 17RE: Use the graph of function f in the figure to determine (to the nearest integer) xory as indicated.... Problem 18RE: Sketch a graph of each of the functions in parts AD using the graph of function f in the figure... Problem 19RE: Complete the square and find the standard form for the quadratic function fx=x2+4x Then write a... Problem 20RE: Match each equation with a graph of one of the functions f,g,m,orn in the figure... Problem 21RE: Referring to the graph of function f in the figure for Problem 20 and using known properties of... Problem 22RE: In Problems 22-25, each equation specifies a function. Determine whether the function is linear,... Problem 23RE: In Problems 22-25, each equation specifies a function. Determine whether the function is linear,... Problem 24RE: In Problems 22-25, each equation specifies a function. Determine whether the function is linear,... Problem 25RE: In Problems 22-25, each equation specifies a function. Determine whether the function is linear,... Problem 26RE: Solve Problems 26-33 for x exactly without using a calculator. logx+5=log2x3 Problem 27RE: Solve Problems 26-33 for x exactly without using a calculator. 2lnx1=lnx25 Problem 28RE: Solve Problems 26-33 for x exactly without using a calculator. 9x1=31+x Problem 29RE: Solve Problems 26-33 for x exactly without using a calculator. e2x=ex23 Problem 30RE: Solve Problems 26-33 for x exactly without using a calculator. 2x2ex=3xex Problem 31RE: Solve Problems 26-33 for x exactly without using a calculator. log1/39=x Problem 32RE: Solve Problems 26-33 for x exactly without using a calculator. logx8=3 Problem 33RE: Solve Problems 26-33 for x exactly without using a calculator. log9x=32 Problem 34RE: Solve Problems 34-41 for x to four decimal places. x=3e1.49 Problem 35RE: Solve Problems 34-41 for x to four decimal places. x=230100.161 Problem 36RE: Solve Problems 34-41 for x to four decimal places. logx=2.0144 Problem 37RE: Solve Problems 34-41 for x to four decimal places. lnx=0.3618 Problem 38RE: Solve Problems 34-41 for x to four decimal places. 35=73x Problem 39RE: Solve Problems 34-41 for x to four decimal places. 0.01=e0.05x Problem 40RE: Solve Problems 34-41 for x to four decimal places. 8,000=4,0001.08x Problem 41RE: Solve Problems 34-41 for x to four decimal places. 52x3=7.08 Problem 42RE: Find the domain of each function: Afx=2x5x2x6Bgx=3x5x Problem 43RE: Find the vertex form for fx=4x2+4x3 and then find the intercepts, the vertex, the maximum or... Problem 44RE: Let fx=ex1andgx=lnx+2. Find all points of intersection for the graphs of f and g. Round answers to... Problem 45RE: In Problems 45and46, use point-by-point plotting to sketch the graph of each function. fx=50x2+1 Problem 46RE: In Problems 45and46, use point-by-point plotting to sketch the graph of each function. fx=662+x2 Problem 47RE: If fx=5x+1, find and simplify each of the following in Problems 47-50. ff0 Problem 48RE: If fx=5x+1, find and simplify each of the following in Problems 47-50. ff1 Problem 49RE: If fx=5x+1, find and simplify each of the following in Problems 47-50. f2x1 Problem 50RE: If fx=5x+1, find and simplify each of the following in Problems 47-50. f4x Problem 51RE: Let fx=32x. Find Af2Bf2+hCf2+hf2Df2+hf2h,h0 Problem 52RE: Let fx=x23x+1. Find AfaBfa+hCfa+hfaDfa+hfah,h0 Problem 53RE: Explain how the graph of mx=x4 is related to graph of y=x. Problem 54RE: Explain how the graph of gx=0.3x3+3 is related to the graph of y=x3. Problem 55RE Problem 56RE: The graph of a function f is formed by vertically stretching the graph of y=x by a factor of 2. and... Problem 57RE: In Problems 57-59, find the equation of any horizontal asymptote. fx=5x+4x23x+4 Problem 58RE: In Problems 57-59, find the equation of any horizontal asymptote. fx=3x2+2x14x25x+3 Problem 59RE: In Problems 57-59, find the equation of any horizontal asymptote. fx=x2+4100x+1 Problem 60RE: In Problems 60 and 61, find the equations of any vertical asymptotes. fx=x2+100x2100 Problem 61RE: In Problems 60 and 61, find the equations of any vertical asymptotes. fx=x2+3xx2+2x Problem 62RE: In Problems 62-67, discuss the validity of each statement. If the statement is always true, explain... Problem 63RE: In Problems 62-67, discuss the validity of each statement. If the statement is always true, explain... Problem 64RE: In Problems 62-67, discuss the validity of each statement. If the statement is always true, explain... Problem 65RE: In Problems 62-67, discuss the validity of each statement. If the statement is always true, explain... Problem 66RE: In Problems 62-67, discuss the validity of each statement. If the statement is always true, explain... Problem 67RE: In Problems 62-67, discuss the validity of each statement. If the statement is always true, explain... Problem 68RE: Sketch the graph of f for x0 fx=9+0.3xif0x205+0.2xifx20 Problem 69RE: Sketch the graph of g for x0. fx=0.5x+5if0x101.2x2if10x302x26ifx30 Problem 70RE: Write an equation for the graph shown in the form y=axh2+k, where a is either 1or1handk are... Problem 71RE: Given fx=0.4x2+3.2x+1.2 find the following algebraically (to one decimal place) without referring to... Problem 72RE: Given fx=0.4x2+3.2x+1.2 in a graphing calculator and find the following (to one decimal place) using... Problem 73RE: Noting that =3.141592654... and 2=1.414213562... explain why the calculator results shown here are... Problem 74RE: Solve Problems 74-77 exactly without using a calculator. logxlog3=log4logx+4 Problem 75RE: Solve Problems 74-77 exactly without using a calculator. ln2x2lnx1=lnx Problem 76RE: Solve Problems 74-77 exactly without using a calculator. lnx+3lnx=2ln2 Problem 77RE: Solve Problems 74-77 exactly without using a calculator. log3x2=2+log9x Problem 78RE: Write lny=5t+lnc in an exponential form free of logarithms. Then solve for y in terms of the... Problem 79RE: Explain why 1 cannot be used as a logarithmic base. Problem 80RE Problem 81RE: Given Gx=0.3x2+1.2x6.9, find the following algebraically (to one decimal place) without the use of a... Problem 82RE: Graph Gx=0.3x2+1.26.9 in a standard viewing window. Then find each of the following (to one decimal... Problem 83RE: Electricity rates. The table shows the electricity rates charged by Easton Utilities in the summer... Problem 84RE: Money growth. Provident Bank of Cincinnati, Ohio, offered a certificate of deposit that paid 1.25... Problem 85RE: Money growth. Capital One Bank of Glen Allen, Virginia, offered a certificate of deposit that paid... Problem 86RE: Money growth. How long will it take for money invested at 6.59 compounded monthly to triple? Problem 87RE: Money growth. How long will it take for money invested at 7.39 compounded continuously to double? Problem 88RE: Break-even analysis. The research department in a company that manufactures AM/FM clock radios... Problem 89RE: Profit-loss analysis. Use the cost and revenue functions from Problem 88. (A) Write a profit... Problem 90RE: Construction. A construction company has 840 feet of chain-link fence that is used to enclose... Problem 91RE: Equilibrium point. A company is planning to introduce a 10-piece set of nonstick cookware. A... Problem 92RE: Crime statistics. According to data published by the FBI, the crime index in the United States has... Problem 93RE: Medicine. One leukemic cell injected into a healthy mouse will divide into 2 cells in about 12 day.... Problem 94RE: Marine biology. The intensity of light entering water is reduced according to the exponential... Problem 95RE: Agriculture. The number of dairy cows on farms in the United States is shown in Table 4 for selected... Problem 96RE: Population growth. The population of some countries has a relative growth rate of 3 (or more) per... Problem 97RE: Medicare. The annual expenditures for Medicare (in billions of dollars) by the U.S. government for... format_list_bulleted


 Glencoe Algebra 1, Student Edition, 9780079039897...AlgebraISBN:9780079039897Author:CarterPublisher:McGraw Hill
 Functions and Change: A Modeling Approach to Coll...AlgebraISBN:9781337111348Author:Bruce Crauder, Benny Evans, Alan NoellPublisher:Cengage Learning
 College AlgebraAlgebraISBN:9781305115545Author:James Stewart, Lothar Redlin, Saleem WatsonPublisher:Cengage Learning
 Big Ideas Math A Bridge To Success Algebra 1: Stu...AlgebraISBN:9781680331141Author:HOUGHTON MIFFLIN HARCOURTPublisher:Houghton Mifflin Harcourt
 Algebra and Trigonometry (MindTap Course List)AlgebraISBN:9781305071742Author:James Stewart, Lothar Redlin, Saleem WatsonPublisher:Cengage Learning


