Concept explainers
Videos
|| A person is walking briskly in a straight line, which we shall call the x axis. Figure 2.42 shows a graph of the person’s position x along this axis as a function of time t. (a) What is the person’s displacement during each of the following time intervals: (i) between t = 1.0 s and t = 10.0 s, (ii) between t = 3.0 s and t = 10.0 s, (iii) between t = 2.0 s and t = 3.0 s, and (iv) between t = 2.0 s and t = 4.0 s? (b) What distance did the person move from (i) t = 0 s to t = 4.0 s, (ii) t = 2.0 s to t = 4.0 s, and (iii) t = 8.0 s to t = 10.0 s?
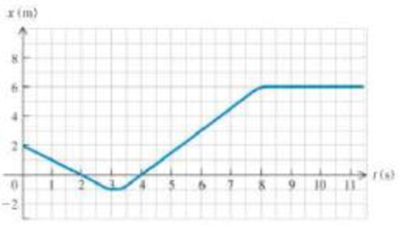
Figure 2.42
Problem 2
2.2. Set Up: From the graph the position xt at each time t is: x1 = 1.0 m, x2 = 0, x3 = −1.0 m, x4 = 0, x8 = 6.0 m, and x0 = 6.0 m.
Solve (a) The displacement is Δx. (i) Δx = x10 − x1 = +5.0 m; (ii) Δx = x10 − x3 = +7.0 m; (iii) Δx = x3 − x2 = −1.0 m; (iv) Δx = x4 − x2 = 0
(b) (i) 3.0 m + 1.0 m = 4.0 m; 90° (ii) 1.0 m + 1.0 m = 2.0 m; (iii) zero (stays at x = 6.0 m)
Want to see the full answer?
Check out a sample textbook solution
Chapter 2 Solutions
College Physics (10th Edition)
Additional Science Textbook Solutions
Biology: Life on Earth (11th Edition)
Chemistry: The Central Science (14th Edition)
Human Physiology: An Integrated Approach (8th Edition)
Cosmic Perspective Fundamentals
Chemistry: An Introduction to General, Organic, and Biological Chemistry (13th Edition)
Campbell Biology (11th Edition)


- ■ Review | Constants A cylinder with a movable piston contains 3.75 mol of N2 gas (assumed to behave like an ideal gas). Part A The N2 is heated at constant volume until 1553 J of heat have been added. Calculate the change in temperature. ΜΕ ΑΣΦ AT = Submit Request Answer Part B ? K Suppose the same amount of heat is added to the N2, but this time the gas is allowed to expand while remaining at constant pressure. Calculate the temperature change. AT = Π ΑΣΦ Submit Request Answer Provide Feedback ? K Nextarrow_forward4. I've assembled the following assortment of point charges (-4 μC, +6 μC, and +3 μC) into a rectangle, bringing them together from an initial situation where they were all an infinite distance away from each other. Find the electric potential at point "A" (marked by the X) and tell me how much work it would require to bring a +10.0 μC charge to point A if it started an infinite distance away (assume that the other three charges remains fixed). 300 mm -4 UC "A" 0.400 mm +6 UC +3 UC 5. It's Friday night, and you've got big party plans. What will you do? Why, make a capacitor, of course! You use aluminum foil as the plates, and since a standard roll of aluminum foil is 30.5 cm wide you make the plates of your capacitor each 30.5 cm by 30.5 cm. You separate the plates with regular paper, which has a thickness of 0.125 mm and a dielectric constant of 3.7. What is the capacitance of your capacitor? If you connect it to a 12 V battery, how much charge is stored on either plate? =arrow_forwardLearning Goal: To understand the meaning and the basic applications of pV diagrams for an ideal gas. As you know, the parameters of an ideal gas are described by the equation pV = nRT, where p is the pressure of the gas, V is the volume of the gas, n is the number of moles, R is the universal gas constant, and T is the absolute temperature of the gas. It follows that, for a portion of an ideal gas, PV T = constant. One can see that, if the amount of gas remains constant, it is impossible to change just one parameter of the gas: At least one more parameter would also change. For instance, if the pressure of the gas is changed, we can be sure that either the volume or the temperature of the gas (or, maybe, both!) would also change. To explore these changes, it is often convenient to draw a graph showing one parameter as a function of the other. Although there are many choices of axes, the most common one is a plot of pressure as a function of volume: a pV diagram. In this problem, you…arrow_forward
- A-e pleasearrow_forwardTwo moles of carbon monoxide (CO) start at a pressure of 1.4 atm and a volume of 35 liters. The gas is then compressed adiabatically to 1/3 this volume. Assume that the gas may be treated as ideal. Part A What is the change in the internal energy of the gas? Express your answer using two significant figures. ΕΠΙ ΑΣΦ AU = Submit Request Answer Part B Does the internal energy increase or decrease? internal energy increases internal energy decreases Submit Request Answer Part C ? J Does the temperature of the gas increase or decrease during this process? temperature of the gas increases temperature of the gas decreases Submit Request Answerarrow_forwardYour answer is partially correct. Two small objects, A and B, are fixed in place and separated by 2.98 cm in a vacuum. Object A has a charge of +0.776 μC, and object B has a charge of -0.776 μC. How many electrons must be removed from A and put onto B to make the electrostatic force that acts on each object an attractive force whose magnitude is 12.4 N? e (mea is the es a co le E o ussian Number Tevtheel ed Media ! Units No units → answe Tr2Earrow_forward
- 4 Problem 4) A particle is being pushed up a smooth slot by a rod. At the instant when 0 = rad, the angular speed of the arm is ė = 1 rad/sec, and the angular acceleration is = 2 rad/sec². What is the net force acting on the 1 kg particle at this instant? Express your answer as a vector in cylindrical coordinates. Hint: You can express the radial coordinate as a function of the angle by observing a right triangle. (20 pts) Ꮎ 2 m Figure 3: Particle pushed by rod along vertical path.arrow_forward4 Problem 4) A particle is being pushed up a smooth slot by a rod. At the instant when 0 = rad, the angular speed of the arm is ė = 1 rad/sec, and the angular acceleration is = 2 rad/sec². What is the net force acting on the 1 kg particle at this instant? Express your answer as a vector in cylindrical coordinates. Hint: You can express the radial coordinate as a function of the angle by observing a right triangle. (20 pts) Ꮎ 2 m Figure 3: Particle pushed by rod along vertical path.arrow_forwardplease solve and answer the question correctly. Thank you!!arrow_forward
 College PhysicsPhysicsISBN:9781305952300Author:Raymond A. Serway, Chris VuillePublisher:Cengage Learning
 College PhysicsPhysicsISBN:9781285737027Author:Raymond A. Serway, Chris VuillePublisher:Cengage Learning
 Principles of Physics: A Calculus-Based TextPhysicsISBN:9781133104261Author:Raymond A. Serway, John W. JewettPublisher:Cengage Learning
 Physics for Scientists and Engineers, Technology ...PhysicsISBN:9781305116399Author:Raymond A. Serway, John W. JewettPublisher:Cengage Learning
 University Physics Volume 1PhysicsISBN:9781938168277Author:William Moebs, Samuel J. Ling, Jeff SannyPublisher:OpenStax - Rice University
 College PhysicsPhysicsISBN:9781938168000Author:Paul Peter Urone, Roger HinrichsPublisher:OpenStax College