Interpretation:
Valance sub shell occupied by the electron should be identified for beryllium and arsenic atom.
Concept introduction:
The periodic table is given below,
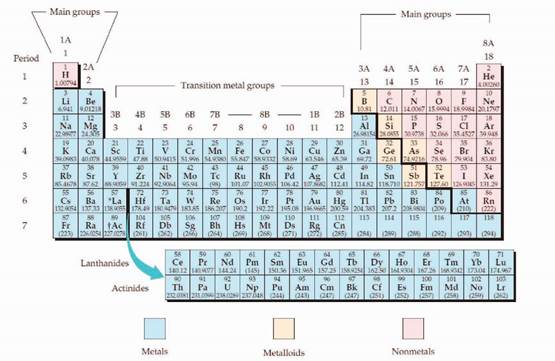
The electron configuration is the distribution of electrons of an atom or molecule in atomic or molecular orbitals. Atom consists of s, p, d, and f orbitals.
The Aufbau principle:
The Aufbau principle is states that in the ground state of an atom, electrons fill atomic orbitals of the lowest available energy levels before occupying higher levels. For example, the 1s shell is filled before the 2s subshell is occupied.
The subshell ordering by this rule is
Want to see the full answer?
Check out a sample textbook solution
Chapter 2 Solutions
Fundamentals of General, Organic, and Biological Chemistry (8th Edition)

- Which type of enzyme catalyses the following reaction? oxidoreductase, transferase, hydrolase, lyase, isomerase, or ligase.arrow_forward+NH+ CO₂ +P H₂N + ATP H₂N NH₂ +ADParrow_forwardWhich type of enzyme catalyses the following reaction? oxidoreductase, transferase, hydrolase, lyase, isomerase, or ligase.arrow_forward
- Which features of the curves in Figure 30-2 indicates that the enzyme is not consumed in the overall reaction? ES is lower in energy that E + S and EP is lower in energy than E + P. What does this tell you about the stability of ES versus E + S and EP versus E + P.arrow_forwardLooking at the figure 30-5 what intermolecular forces are present between the substrate and the enzyme and the substrate and cofactors.arrow_forwardprovide short answers to the followings Urgent!arrow_forward
- Pyruvate is accepted into the TCA cycle by a “feeder” reaction using the pyruvatedehydrogenase complex, resulting in acetyl-CoA and CO2. Provide a full mechanismfor this reaction utilizing the TPP cofactor. Include the roles of all cofactors.arrow_forwardB- Vitamins are converted readily into important metabolic cofactors. Deficiency inany one of them has serious side effects. a. The disease beriberi results from a vitamin B 1 (Thiamine) deficiency and ischaracterized by cardiac and neurological symptoms. One key diagnostic forthis disease is an increased level of pyruvate and α-ketoglutarate in thebloodstream. How does this vitamin deficiency lead to increased serumlevels of these factors? b. What would you expect the effect on the TCA intermediates for a patientsuffering from vitamin B 5 deficiency? c. What would you expect the effect on the TCA intermediates for a patientsuffering from vitamin B 2 /B 3 deficiency?arrow_forwardDraw the Krebs Cycle and show the entry points for the amino acids Alanine,Glutamic Acid, Asparagine, and Valine into the Krebs Cycle - (Draw the Mechanism). How many rounds of Krebs will be required to waste all Carbons of Glutamic Acidas CO2?arrow_forward

 Biology (MindTap Course List)BiologyISBN:9781337392938Author:Eldra Solomon, Charles Martin, Diana W. Martin, Linda R. BergPublisher:Cengage Learning