Videos
(a)
To sketch the cycle on PV diagram.
(a)
Explanation of Solution
Introduction:
The Brayton cycle consists of various thermodynamic process, an adiabatic compression, an isobaric expansion, an adiabatic expansion and an isobaric compression.
The figure below shows the PV curve of Brayton cycle,
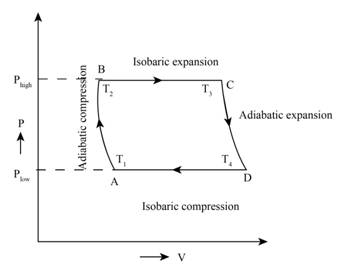
Figure (1)
From the range of temperature
Conclusion:
Therefore, the diagram of PV curve on Brayton cycle is shown in figure (1).
(b)
Show that the efficiency of the cycle as
(b)
Answer to Problem 83P
The efficiency of the cycle as
Explanation of Solution
Formula used:
The expression for the efficiency is,
Here, the heat absorbed from the heat reservoir during isobaric expansion is
The expression for change in enthalpy from first law of
The expression for
The expression for work done throught the cycle is,
Calculation:
The heat absorbed from the heat reservoir during isobaric expansion is calculated as,
By using the ideal gas law we get,
Similarly,
The delivered to cold reservoir during isobaric compression is calculated as
By using the ideal gas law we get
The efficiency is calculated as,
Conclusion:
Therefore, the efficiency of the cycle as
(c)
To show the efficiency is
(c)
Answer to Problem 83P
The efficiency is
Explanation of Solution
Formula used:
The expression for adiabatic process is given as,
Calculation:
The relation between pressure and temperature for adiabatic process AB is calculated as,
The relation between pressure and temperature for adiabatic process CD is calculated as,
Subtracting equation (1) with equation (2) we get,
By using efficiency from part (a) we get,
Conclusion:
Therefore, the efficiency is
Want to see more full solutions like this?
Chapter 19 Solutions
PHYSICS F/SCI.+ENGRS.,STAND.-W/ACCESS


- You are standing a distance x = 1.75 m away from this mirror. The object you are looking at is y = 0.29 m from the mirror. The angle of incidence is θ = 30°. What is the exact distance from you to the image?arrow_forwardFor each of the actions depicted below, a magnet and/or metal loop moves with velocity v→ (v→ is constant and has the same magnitude in all parts). Determine whether a current is induced in the metal loop. If so, indicate the direction of the current in the loop, either clockwise or counterclockwise when seen from the right of the loop. The axis of the magnet is lined up with the center of the loop. For the action depicted in (Figure 5), indicate the direction of the induced current in the loop (clockwise, counterclockwise or zero, when seen from the right of the loop). I know that the current is clockwise, I just dont understand why. Please fully explain why it's clockwise, Thank youarrow_forwardA planar double pendulum consists of two point masses \[m_1 = 1.00~\mathrm{kg}, \qquad m_2 = 1.00~\mathrm{kg}\]connected by massless, rigid rods of lengths \[L_1 = 1.00~\mathrm{m}, \qquad L_2 = 1.20~\mathrm{m}.\]The upper rod is hinged to a fixed pivot; gravity acts vertically downward with\[g = 9.81~\mathrm{m\,s^{-2}}.\]Define the generalized coordinates \(\theta_1,\theta_2\) as the angles each rod makes with thedownward vertical (positive anticlockwise, measured in radians unless stated otherwise).At \(t=0\) the system is released from rest with \[\theta_1(0)=120^{\circ}, \qquad\theta_2(0)=-10^{\circ}, \qquad\dot{\theta}_1(0)=\dot{\theta}_2(0)=0 .\]Using the exact nonlinear equations of motion (no small-angle or planar-pendulumapproximations) and assuming the rods never stretch or slip, determine the angle\(\theta_2\) at the instant\[t = 10.0~\mathrm{s}.\]Give the result in degrees, in the interval \((-180^{\circ},180^{\circ}]\).arrow_forward
- What are the expected readings of the ammeter and voltmeter for the circuit in the figure below? (R = 5.60 Ω, ΔV = 6.30 V) ammeter I =arrow_forwardsimple diagram to illustrate the setup for each law- coulombs law and biot savart lawarrow_forwardA circular coil with 100 turns and a radius of 0.05 m is placed in a magnetic field that changes at auniform rate from 0.2 T to 0.8 T in 0.1 seconds. The plane of the coil is perpendicular to the field.• Calculate the induced electric field in the coil.• Calculate the current density in the coil given its conductivity σ.arrow_forward
- An L-C circuit has an inductance of 0.410 H and a capacitance of 0.250 nF . During the current oscillations, the maximum current in the inductor is 1.80 A . What is the maximum energy Emax stored in the capacitor at any time during the current oscillations? How many times per second does the capacitor contain the amount of energy found in part A? Please show all steps.arrow_forwardA long, straight wire carries a current of 10 A along what we’ll define to the be x-axis. A square loopin the x-y plane with side length 0.1 m is placed near the wire such that its closest side is parallel tothe wire and 0.05 m away.• Calculate the magnetic flux through the loop using Ampere’s law.arrow_forwardDescribe the motion of a charged particle entering a uniform magnetic field at an angle to the fieldlines. Include a diagram showing the velocity vector, magnetic field lines, and the path of the particle.arrow_forward
- Discuss the differences between the Biot-Savart law and Coulomb’s law in terms of their applicationsand the physical quantities they describe.arrow_forwardExplain why Ampere’s law can be used to find the magnetic field inside a solenoid but not outside.arrow_forward3. An Atwood machine consists of two masses, mA and m B, which are connected by an inelastic cord of negligible mass that passes over a pulley. If the pulley has radius RO and moment of inertia I about its axle, determine the acceleration of the masses mA and m B, and compare to the situation where the moment of inertia of the pulley is ignored. Ignore friction at the axle O. Use angular momentum and torque in this solutionarrow_forward

 Principles of Physics: A Calculus-Based TextPhysicsISBN:9781133104261Author:Raymond A. Serway, John W. JewettPublisher:Cengage Learning
 Physics for Scientists and Engineers, Technology ...PhysicsISBN:9781305116399Author:Raymond A. Serway, John W. JewettPublisher:Cengage Learning
 Physics for Scientists and Engineers: Foundations...PhysicsISBN:9781133939146Author:Katz, Debora M.Publisher:Cengage Learning
 College PhysicsPhysicsISBN:9781305952300Author:Raymond A. Serway, Chris VuillePublisher:Cengage Learning
 College PhysicsPhysicsISBN:9781285737027Author:Raymond A. Serway, Chris VuillePublisher:Cengage Learning