Horngren's Cost Accounting: A Managerial Emphasis (16th Edition)
16th Edition
ISBN: 9780134475585
Author: Srikant M. Datar, Madhav V. Rajan
Publisher: PEARSON
expand_more
expand_more
format_list_bulleted
Textbook Question
Chapter 19, Problem 19.18E
Costs of quality. (CMA, adapted) Osborn, Inc., produces cell phone equipment. Amanda Westerly, Osborn’s president, implemented a quality-improvement program that has now been in operation for 2 years. The cost report shown here has recently been issued.
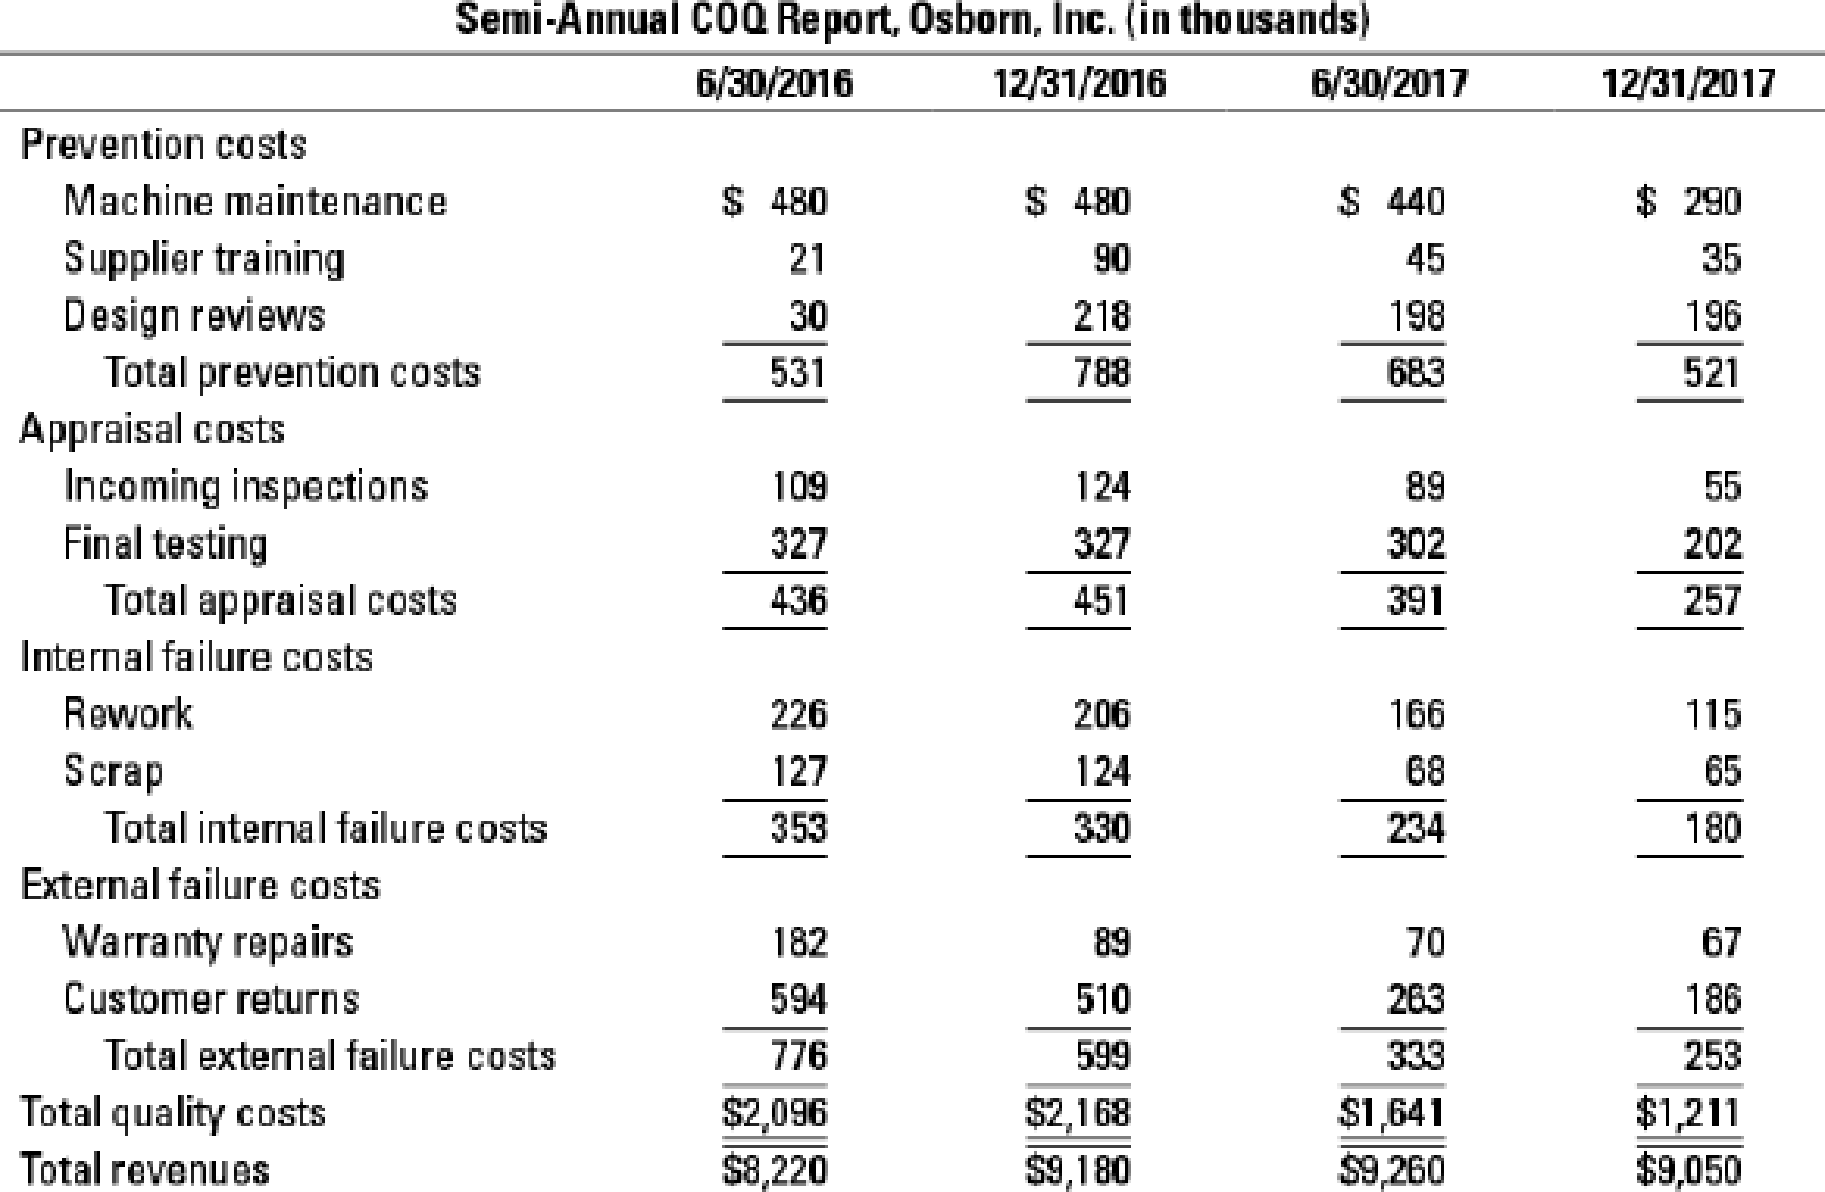
- 1. For each period, calculate the ratio of each COQ category to revenues and to total quality costs.
Required
- 2. Based on the results of requirement 1, would you conclude that Osborn’s quality program has been successful? Prepare a short report to present your case.
- 3. Based on the 2015 survey, Amanda Westerly believed that Osborn had to improve product quality. In making her case to Osborn management, how might Westerly have estimated the opportunity cost of not implementing the quality-improvement program?
Expert Solution & Answer
Trending nowThis is a popular solution!
Students have asked these similar questions
Hi, can someone help me with this question please?
Prepare a COQ report by calculating the costs of quality for each category and the ratio of each COQ category to revenues and total quality costs.
Based on the 2015 survey, Amanda Westerly believed that Osborn had to improve product quality. In making her case to Osborn management, how might Westerly have estimated the opportunity cost of not implementing the quality-improvement program?
Chapter 19 Solutions
Horngren's Cost Accounting: A Managerial Emphasis (16th Edition)
Ch. 19 - Describe two benefits of improving quality.Ch. 19 - Prob. 19.2QCh. 19 - Name two items classified as prevention costs.Ch. 19 - Give two examples of appraisal costs.Ch. 19 - Distinguish between internal failure costs and...Ch. 19 - Describe three methods that companies use to...Ch. 19 - Companies should focus on financial measures of...Ch. 19 - Give two examples of nonfinancial measures of...Ch. 19 - Give two examples of nonfinancial measures of...Ch. 19 - When evaluating alternative ways to improve...
Ch. 19 - Distinguish between customer-response time and...Ch. 19 - Prob. 19.12QCh. 19 - Give two reasons why delays occur.Ch. 19 - Companies should always make and sell all products...Ch. 19 - Prob. 19.15QCh. 19 - Rector Corporation is examining its quality...Ch. 19 - Six Sigma is a continuous quality improvement...Ch. 19 - Costs of quality. (CMA, adapted) Osborn, Inc.,...Ch. 19 - Costs of quality analysis. Adirondack Company...Ch. 19 - Costs-of-quality analysis. Safe Travel produces...Ch. 19 - Costs of quality, quality improvement. iCover...Ch. 19 - Prob. 19.22ECh. 19 - Prob. 19.23ECh. 19 - Waiting time. Its a Dogs World (IDW) makes toys...Ch. 19 - Waiting time, service industry. The registration...Ch. 19 - Waiting time, cost considerations, customer...Ch. 19 - Nonfinancial measures of quality and time. For the...Ch. 19 - Nonfinancial measures of quality, manufacturing...Ch. 19 - Statistical quality control. Harvest Cereals...Ch. 19 - Quality improvement, Pareto diagram,...Ch. 19 - Quality improvement, relevant costs, and relevant...Ch. 19 - Quality improvement, relevant costs, and relevant...Ch. 19 - Waiting times, manufacturing cycle times. The...Ch. 19 - Prob. 19.34PCh. 19 - Manufacturing cycle times, relevant revenues, and...Ch. 19 - Compensation linked with profitability, waiting...Ch. 19 - Ethics and quality. Weston Corporation...Ch. 19 - Prob. 19.38P
Knowledge Booster
Learn more about
Need a deep-dive on the concept behind this application? Look no further. Learn more about this topic, accounting and related others by exploring similar questions and additional content below.Similar questions
- The controller of Emery, Inc. has computed quality costs as a percentage of sales for the past 5 years (20X1 was the first year the company implemented a quality improvement program). This information is as follows: Required: 1. Prepare a trend graph for total quality costs. Comment on what the graph has to say about the success of the quality improvement program. 2. Prepare a graph that shows the trend for each quality cost category. What does the graph have to say about the success of the quality improvement program? Does this graph supply more insight than the total cost trend graph does? 3. Prepare a graph that compares the trend in relative control costs versus relative failure costs. Comment on the significance of this trend.arrow_forwardPlot the relationship between customer-service costs and number of service reports. Is the relationship economically plausible?arrow_forwardUse the high-low method to compute the cost function relating customer-service costs to the number of service reports.arrow_forward
- What variables, in addition to number of service reports, might be cost drivers of weekly customerservice costs of Camilla Products?arrow_forwardSuppose that Kicker had the following sales and cost experience (in thousands of dollars) for May of the current year and for May of the prior year: In May of the prior year, Kicker started an intensive quality program designed to enable it to build original equipment manufacture (OEM) speaker systems for a major automobile company. The program was housed in research and development. In the beginning of the current year, Kickers accounting department exercised tighter control over sales commissions, ensuring that no dubious (e.g., double) payments were made. The increased sales in the current year required additional warehouse space that Kicker rented in town. (Round ratios to four decimal places. Round sales dollars computations to the nearest dollar.) Required: 1. Calculate the contribution margin ratio for May of both years. 2. Calculate the break-even point in sales dollars for both years. 3. Calculate the margin of safety in sales dollars for both years. 4. CONCEPTUAL CONNECTION Analyze the differences shown by your calculations in Requirements 1, 2, and 3.arrow_forwardGagnon Company reported the following sales and quality costs for the past four years. Assume that all quality costs are variable and that all changes in the quality cost ratios are due to a quality improvement program. Required: 1. Compute the quality costs for all four years. By how much did net income increase from Year 1 to Year 2 because of quality improvements? From Year 2 to Year 3? From Year 3 to Year 4? 2. The management of Gagnon Company believes it is possible to reduce quality costs to 2.5 percent of sales. Assuming sales will continue at the Year 4 level, calculate the additional profit potential facing Gagnon. Is the expectation of improving quality and reducing costs to 2.5 percent of sales realistic? Explain. 3. Assume that Gagnon produces one type of product, which is sold on a bid basis. In Years 1 and 2, the average bid was 400. In Year 1, total variable costs were 250 per unit. In Year 3, competition forced the bid to drop to 380. Compute the total contribution margin in Year 3 assuming the same quality costs as in Year 1. Now, compute the total contribution margin in Year 3 using the actual quality costs for Year 3. What is the increase in profitability resulting from the quality improvements made from Year 1 to Year 3?arrow_forward
- The production department is proposing the purchase of an automatic insertion machine. It has identified three machines and has asked the accountant to analyze them to determine which one has the best average rate of return. Machine A Machine B Machine C $83,087.40 $73,001.40 322,364.00 276,958.00 486,676.00 Estimated average income $45,130.96 Average investment Oa. Machine B Ob. Machine C Oc. Machine A Od. Machines B and C have the same preferred average rate of return.arrow_forwardIdentify the costs-of-quality category (prevention, appraisal, internal failure, and external failure) for each of these costs.arrow_forwardEstimating a cost function, high-low method. Lacy Dallas is examining customer-service costs in the southern region of Camilla Products. Camilla Products has more than 200 separate electrical products that are sold with a 6-month guarantee of full repair or replacement with a new product. When a product is returned by a customer, a service report is prepared. This service report includes details of the problem and the time and cost of resolving the problem. Weekly data for the most recent 8-week period are as follows:arrow_forward
- Nicholson Co sells mobile telephones. It supplies its customers with telephones and wireless telephone connections. Customers pay an annual fee plus a monthly charge based on calls made.The company has recently employed a consultant to install a balanced scorecard system of performance measurement and to benchmark the results against those of Nicholson Co’s competitors. Unfortunately the consultant was called away before the work was finished. You have been asked to complete the work. The following data is available.Nicholson Co Operating data for the year ended 30 November 2013 Sales revenue $480 millionSales attributable to new products $8 millionAverage capital employed $192 millionProfit before interest and tax $48 millionAverage numbers of customers 1,960,000Average number of telephones returned for repair each year 10,000Number of bill queries 12,000Number of customer complaints 21,600Number of customers lost 117,600Average number of telephones unrepaired at the end of each day…arrow_forwardNicholson Co sells mobile telephones. It supplies its customers with telephones and wireless telephone connections. Customers pay an annual fee plus a monthly charge based on calls made. The company has recently employed a consultant to install a balanced scorecard system of performance measurement and to benchmark the results against those of Nicholson Co's competitors. Unfortunately the consultant was called away before the work was finished. You have been asked to complete the work. The following data is available. Nicholson Co Operating data for the year ended 30 November 2013 Sales revenue $480 million Sales attributable to new products $8 million Average capital employed $192 million Profit before interest and tax $48 million Average number of customers 1,960,000 Average number of telephones returned for repair each day 10,000 Number of bill queries 12,000 Number of customer complaints 21,600 Number of customers lost 117,600 Average number of telephones unrepaired at the end of…arrow_forwardGadubhaiarrow_forward
arrow_back_ios
SEE MORE QUESTIONS
arrow_forward_ios
Recommended textbooks for you
- Cornerstones of Cost Management (Cornerstones Ser...AccountingISBN:9781305970663Author:Don R. Hansen, Maryanne M. MowenPublisher:Cengage LearningManagerial Accounting: The Cornerstone of Busines...AccountingISBN:9781337115773Author:Maryanne M. Mowen, Don R. Hansen, Dan L. HeitgerPublisher:Cengage LearningEssentials of Business Analytics (MindTap Course ...StatisticsISBN:9781305627734Author:Jeffrey D. Camm, James J. Cochran, Michael J. Fry, Jeffrey W. Ohlmann, David R. AndersonPublisher:Cengage Learning
- Principles of Cost AccountingAccountingISBN:9781305087408Author:Edward J. Vanderbeck, Maria R. MitchellPublisher:Cengage Learning
Cornerstones of Cost Management (Cornerstones Ser...
Accounting
ISBN:9781305970663
Author:Don R. Hansen, Maryanne M. Mowen
Publisher:Cengage Learning
Managerial Accounting: The Cornerstone of Busines...
Accounting
ISBN:9781337115773
Author:Maryanne M. Mowen, Don R. Hansen, Dan L. Heitger
Publisher:Cengage Learning
Essentials of Business Analytics (MindTap Course ...
Statistics
ISBN:9781305627734
Author:Jeffrey D. Camm, James J. Cochran, Michael J. Fry, Jeffrey W. Ohlmann, David R. Anderson
Publisher:Cengage Learning
Principles of Cost Accounting
Accounting
ISBN:9781305087408
Author:Edward J. Vanderbeck, Maria R. Mitchell
Publisher:Cengage Learning
Understanding Systems Development Life Cycle; Author: GreggU;https://www.youtube.com/watch?v=shNOYFlmBOU;License: Standard Youtube License