Concept explainers
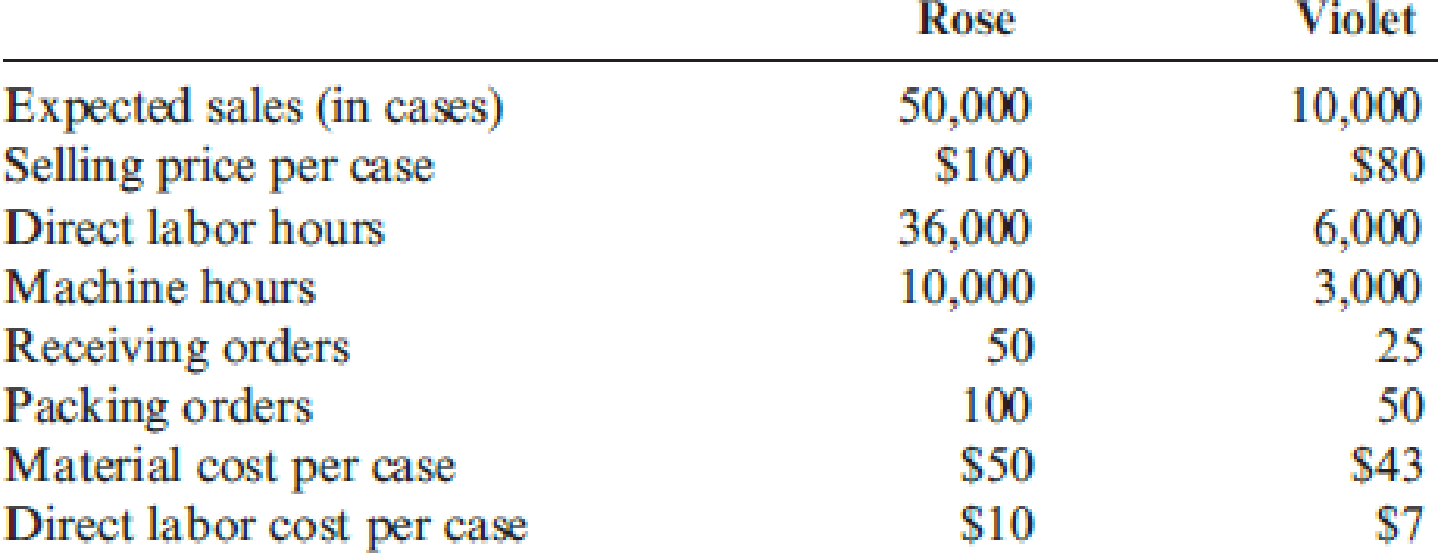
Good Scent, Inc., produces two colognes: Rose and Violet. Of the two, Rose is more popular. Data concerning the two products follow:

The company uses a conventional costing system and assigns

Required:
- 1. Using the conventional approach, compute the number of cases of Rose and the number of cases of Violet that must be sold for the company to break even.
- 2. Using an activity-based approach, compute the number of cases of each product that must be sold for the company to break even.
1.
Ascertain the break-even point using the conventional approach.
Explanation of Solution
Contribution Margin Ratio: The contribution margin ratio shows the amount of difference in the actual sales value and the variable expenses in percentage. This margin indicates that percentage which is available for sale above the fixed costs and the profit. The formula for variable cost ratio is shown below:
Break-Even Point: The break-even point refers to the point of sales at which the firm neither earns a profit nor suffers a loss. It is also known as the point of sales or sales value at which the firm recovers the entire cost of fixed and variable nature.
Break-Even in sales revenue: The break-even in sales revenue refers to the sales volume required to cover the fixed and variable costs and left out with neither profit nor loss.
Compute the package contribution margin units:
| Input | Price (A) | Unit Variable cost (B) | Unit Contribution margin | Sales Mix (D) |
Package Unit Contribution margin |
| Rose | $100.00 | $67.92 | $32.08 | 5 | $160.40 |
| Violet | $80.00 | $56.60 | $23.40 | 1 | $23.40 |
| Package Total | $183.80 |
Table (1)
Compute the break-even packages:
The number of break-even packages is 2,992.
Compute the break-even for Rose:
The number of break-even for Rose is 14,960.
Compute the break-even for Violet:
The number of break-even for Violet is 2,992.
Working Notes:
Compute the unit variable cost for rose:
The variable cost per unit for rose is $67.92.
Compute the unit variable cost for violet:
The variable cost per unit for violet is $56.60.
2.
Compute the break-even point and the incremental profit using the activity based costing.
Explanation of Solution
Compute the unit-based variable cost per unit:
| Particulars | Rose | Violet |
| Unit-based variable costs: | ||
| Prime costs | $60.00 | $50.00 |
| Benefits | $3.43 | $2.86 |
| Machine costs | $4.03 | $6.05 |
| Total | $67.46 | $58.91 |
| Sales Mix | ||
| Package Cost | $337.30 | $58.91 |
Table (2)
Compute the total package cost:
The total package cost is $396.21 (X1).
Compute the benefits cost per unit for rose:
The benefits cost per unit for rose is $3.43.
Compute the benefits cost per unit for violet:
The benefits cost per unit for violet is $2.86.
Compute the unit machine cost for rose:
The machine cost per unit for rose is $4.03.
Compute the unit machine cost for violet:
The machine cost per unit for violet is $6.05.
Compute the non-unit-based variable overhead cost per unit:
| Particulars | Calculations | Amount ($) |
| Non-unit-based variable costs: | ||
| Receiving (X2) | $3,000 | |
| Packing (X3) | $833.33 | |
Table (2)
Compute the sales and variable cost per unit:
| Particulars | Calculations | Amount ($) |
| Sales | $580.00 | |
| Variable cost | $396.20 | |
| Contribution margin | $183.80 |
Table (2)
CVP analysis:
Let,
X1 = Number of packages
X2 = Number of receiving orders
X3 = Number of packing orders
The number of break-even packages is 2,992.
Compute the break-even for Rose:
The number of break-even for Rose is 14,960.
Compute the break-even for Violet:
The number of break-even for Violet is 2,992.
Thus, the break-even point for Roses and Violets are same under both the requirements.
Want to see more full solutions like this?
Chapter 16 Solutions
Cornerstones of Cost Management (Cornerstones Series)
- Pell Company acquires 80% of Demers Company for $500,000 on January 1, 2022. Demers reported common stock of $300,000 and retained earnings of $210,000 on that date. Equipment was undervalued by $30,000 and buildings were undervalued by $40,000, each having a 10-year remaining life. Any excess consideration transferred over fair value was attributed to goodwill with an indefinite life. Based on an annual review, goodwill has not been impaired. Demers earns income and pays dividends as follows: 2022 2023 2024 Net income $ 100,000 $ 120,000 $ 130,000 Dividends 40,000 50,000 60,000 Assume the partial equity method is applied. Compute the noncontrolling interest in Demers at December 31, 2024. Multiple Choice $146,800 $160,800 $107,800 $80,000 $140,000arrow_forwardProvide General Accounting Questionarrow_forwardProvide answer pleasearrow_forward
 Cornerstones of Cost Management (Cornerstones Ser...AccountingISBN:9781305970663Author:Don R. Hansen, Maryanne M. MowenPublisher:Cengage LearningPrinciples of Accounting Volume 2AccountingISBN:9781947172609Author:OpenStaxPublisher:OpenStax College

