Concept explainers
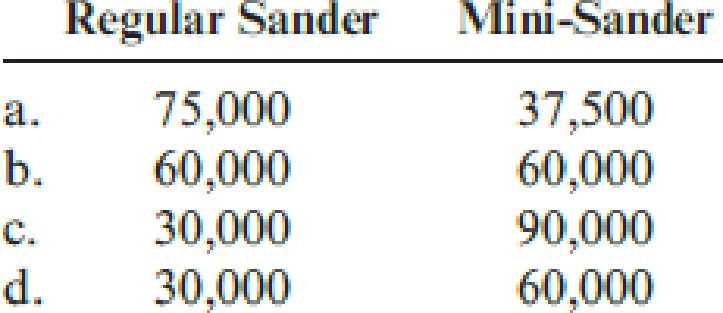
More-Power Company has projected sales of 75,000 regular sanders and 30,000 mini-sanders for next year. The

Required:
- 1. Set up the given income statement on a spreadsheet (e.g., ExcelTM). Then, substitute the following sales mixes, and calculate operating income. Be sure to print the results for each sales mix (a through d).

- 2. Calculate the break-even units for each product for each of the preceding sales mixes.
1.
Show the income statement on the spreadsheet, for the given sales mixes and compute the operating income.
Explanation of Solution
Sales mix: Sales mix refers to relative distribution of the total sales amongst the total number of units sold by a company. It is also expressed as a percentage of units sold for each product produced with respect to the total units sold for all the products produced.
Compute the operating income for the given sales mixes:
| Particulars | RegularSander | Mini-Sander | Amount ($) |
| Sales Mix of 2:1 | |||
| Sales | $3,000,000 | $2,250,000 | $5,250,000 |
| Less: Variable expenses | $1,800,000 | $1,125,000 | $2,925,000 |
| Contribution margin | $1,200,000 | $1,125,000 | $2,325,000 |
| Less: Direct Fixed Expenses | $250,000 | $450,000 | $700,000 |
| Product Margin | $950,000 | $675,000 | $1,625,000 |
| Less: Common fixed expenses | $600,000 | ||
| Operating income | $1,025,000 | ||
| Sales Mix of 1:1 | |||
| Sales | $2,400,000 | $3,600,000 | $6,000,000 |
| Less: Variable expenses | $1,440,000 | $1,800,000 | $3,240,000 |
| Contribution margin | $960,000 | $1,800,000 | $2,760,000 |
| Less: Direct Fixed Expenses | $250,000 | $450,000 | $700,000 |
| Product Margin | $710,000 | $1,350,000 | $2,060,000 |
| Less: Common fixed expenses | $600,000 | ||
| Operating income | $1,460,000 | ||
| Sales Mix of 1:3 | |||
| Sales | $1,200,000 | $5,400,000 | $6,600,000 |
| Less: Variable expenses | $720,000 | $2,700,000 | $3,420,000 |
| Contribution margin | $480,000 | $2,700,000 | $3,180,000 |
| Less: Direct Fixed Expenses | $250,000 | $450,000 | $700,000 |
| Product Margin | $230,000 | $2,250,000 | $2,480,000 |
| Less: Common fixed expenses | $600,000 | ||
| Operating income | $1,880,000 | ||
| Sales Mix of 1:2 | |||
| Sales | $1,200,000 | $3,600,000 | $4,800,000 |
| Less: Variable expenses | $720,000 | $1,800,000 | $2,520,000 |
| Contribution margin | $480,000 | $1,800,000 | $2,280,000 |
| Less: Direct Fixed Expenses | $250,000 | $450,000 | $700,000 |
| Product Margin | $230,000 | $1,350,000 | $1,580,000 |
| Less: Common fixed expenses | $600,000 | ||
| Operating income | $980,000 |
Table (1)
Working notes:
Compute the sales mix ratio for given sales mixes.
| Particulars | RegularSander | Mini-Sander | Sales Mix Ratio |
| Number of actual units | 75000 | 30000 | 5:2 |
| Sales mix a | 75000 | 37500 | 2:1 |
| Sales mix b | 60000 | 60000 | 1:1 |
| Sales mix c | 30000 | 90000 | 1:3 |
| Sales mix d | 30000 | 60000 | 1:2 |
Table (2)
Compute the sales amount and variable expenses for the given sales.
| Particulars | Cost per unit ($) | Number of units | Amount ($) |
| Sales Mix of 2:1 | |||
| Sales of Regular Sander | $40 | 75000 | $3,000,000 |
| Sales of Mini Sander | $60 | 37500 | $2,250,000 |
| Variable Cost of Regular Sander | $24 | 75000 | $1,800,000 |
| Variable Cost of Mini Sander | $30 | 37500 | $1,125,000 |
| Sales Mix of 1:1 | |||
| Sales of Regular Sander | $40 | 60000 | $2,400,000 |
| Sales of Mini Sander | $60 | 60000 | $3,600,000 |
| Variable Cost of Regular Sander | $24 | 60000 | $1,440,000 |
| Variable Cost of Mini Sander | $30 | 60000 | $1,800,000 |
| Sales Mix of 1:3 | |||
| Sales of Regular Sander | $40 | 30000 | $1,200,000 |
| Sales of Mini Sander | $60 | 90000 | $5,400,000 |
| Variable Cost of Regular Sander | $24 | 30000 | $720,000 |
| Variable Cost of Mini Sander | $30 | 90000 | $2,700,000 |
| Sales Mix of 1:2 | |||
| Sales of Regular Sander | $40 | 30000 | $1,200,000 |
| Sales of Mini Sander | $60 | 60000 | $3,600,000 |
| Variable Cost of Regular Sander | $24 | 30000 | $720,000 |
| Variable Cost of Mini Sander | $30 | 60000 | $1,800,000 |
Table (3)
2.
Compute for each sales mix the break-even point.
Explanation of Solution
Sales mix a:
Compute the package contribution margin units:
| Input | Price (A) | Unit Variable cost (B) | Unit Contribution margin | Sales Mix (D) |
Package Unit Contribution margin |
| Regular Sander | $40 | $24 | $16 | 2 | $32 |
| Mini Sander | $60 | $30 | $30 | 1 | $30 |
| Package Total | $62 |
Table (4)
Compute the break-even packages:
The number of break-even packages is 20,967.74.
Compute the break-even for Regular Sander:
The number of break-even for Regular Sander is 41,935.
Compute the break-even for Mini Sander:
The number of break-even for Mini Sander is 20,968.
Sales mix b:
Compute the package contribution margin units:
| Input | Price (A) | Unit Variable cost (B) | Unit Contribution margin | Sales Mix (D) |
Package Unit Contribution margin |
| Regular Sander | $40 | $24 | $16 | 1 | $16 |
| Mini Sander | $60 | $30 | $30 | 1 | $30 |
| Package Total | $46 |
Table (5)
Compute the break-even packages:
The number of break-even packages is 28,260.87.
Compute the break-even for Regular Sander:
The number of break-even for Regular Sander is 28,261.
Compute the break-even for Mini Sander:
The number of break-even for Mini Sander is 28,261.
Sales mix c:
Compute the package contribution margin units:
| Input | Price (A) | Unit Variable cost (B) | Unit Contribution margin | Sales Mix (D) |
Package Unit Contribution margin |
| Regular Sander | $40 | $24 | $16 | 1 | $16 |
| Mini Sander | $60 | $30 | $30 | 3 | $90 |
| Package Total | $106 |
Table (6)
Compute the break-even packages:
The number of break-even packages is 12,264.15.
Compute the break-even for Regular Sander:
The number of break-even for Regular Sander is 12,264.
Compute the break-even for Mini Sander:
The number of break-even for Mini Sander is 36,792.
Sales mix d:
Compute the package contribution margin units:
| Input | Price (A) | Unit Variable cost (B) | Unit Contribution margin | Sales Mix (D) |
Package Unit Contribution margin |
| Regular Sander | $40 | $24 | $16 | 1 | $16 |
| Mini Sander | $60 | $30 | $30 | 2 | $60 |
| Package Total | $76 |
Table (7)
Compute the break-even packages:
The number of break-even packages is 17,105.26.
Compute the break-even for Regular Sander:
The number of break-even for Regular Sander is 17,105.
Compute the break-even for Mini Sander:
The number of break-even for Mini Sander is 34,211.
Want to see more full solutions like this?
Chapter 16 Solutions
Cornerstones of Cost Management (Cornerstones Series)
- stockholders' equity for Summit Enterprises isarrow_forwardFinancial Accountingarrow_forwardQuestion 4Waterfront Inc. wishes to borrow on a short-term basis withoutreducing its current ratio below 1.25. At present its current assetsand current liabilities are $1,600 and $1,000 respectively. How muchcan Waterfront Inc. borrow?arrow_forward
- Question 6During 2019, Bitsincoins Corporation had EBIT of $100,000, a changein net fixed assets of $400,000, an increase in net current assets of$100,000, an increase in spontaneous current liabilities of $400,000,a depreciation expense of $50,000, and a tax rate of 30%. Based onthis information, what is Bitsincoin’s free cash flow?arrow_forwardCariveh Co sells automotive supplies from 25 different locations in one country. Each branch has up to 30 staff working there, although most of the accounting systems are designed and implemented from the company's head office. All accounting systems, apart from petty cash, are computerised, with the internal audit department frequently advising and implementing controls within those systems.Cariveh has an internal audit department of six staff, all of whom have been employed at Cariveh for a minimum of five years and some for as long as 15 years. In the past, the chief internal auditor appoints staff within the internal audit department, although the chief executive officer (CEO) is responsible for appointing the chief internal auditor.The chief internal auditor reports directly to the finance director. The finance director also assists the chief internal auditor in deciding on the scope of work of the internal audit department.You are an audit manager in the internal audit department…arrow_forwardJinkal Sports Co. sells a product for $55 per unit. The variable cost per unit is $28, and monthly fixed costs are $270,000. How many units must be sold to earn a target profit of $120,000?arrow_forward
- return on equity (ROE)? account questionarrow_forwardits net income?arrow_forwardSilver Star Manufacturing has $20 million in sales, an ROE of 15%, and a total assets turnover of 5 times. Common equity on the firm's balance sheet is 30% of its total assets. What is its net income? Round the answer to the nearest cent.arrow_forward
 Cornerstones of Cost Management (Cornerstones Ser...AccountingISBN:9781305970663Author:Don R. Hansen, Maryanne M. MowenPublisher:Cengage Learning
 Managerial Accounting: The Cornerstone of Busines...AccountingISBN:9781337115773Author:Maryanne M. Mowen, Don R. Hansen, Dan L. HeitgerPublisher:Cengage Learning

