a.
To calculate; a
a.
Explanation of Solution

b.
To calculate; does the model fit in the data.
b.
Answer to Problem 90E
Solution: Good fit
Explanation of Solution
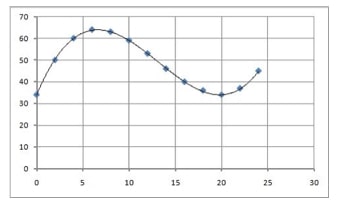
All of the points seems to be very close to graph of model. Hence, it is a good fit.
c.
To calculate; approximation times when temperature was increasing and decreasing using the graph.
c.
Answer to Problem 90E
Increasing:
Decreasing:
Explanation of Solution

Using the graph to approximate when temperature is increasing and decreasing.
Hence,
Increasing:
Decreasing:
d.
To calculate; approximate maximum and minimum temperature during the
d.
Answer to Problem 90E
Maximum:
Minimum:
Explanation of Solution

Using the graph to approximate when temperature is maximum and minimum.
Hence maximum temperature is
e.
To calculate; predictions of the temperature in city during next
e.
Answer to Problem 90E
Solution: No.
Explanation of Solution
The given model is still increasing after
Chapter 1 Solutions
EBK PRECALCULUS W/LIMITS
- Pls help ASAParrow_forwardPls help ASAParrow_forward9. a) Determie values of a and b so that the function is continuous. ax - 2b f(x) 2 x≤-2 -2x+a, x ≥2 \-ax² - bx + 1, −2 < x < 2) 9b) Consider f(x): = 2x²+x-3 x-b and determine all the values of b such that f(x) does not have a vertical asymptote. Show work.arrow_forward
- Pls help ASAParrow_forward3. True False. If false create functions that prove it is false. Note: f(x) = g(x). a) If_lim ƒ(x) = ∞ and_lim g(x) = ∞,then_lim [ƒ(x) − g(x)] = 0 x→ 0+ x→0+ x→0+ b) If h(x) and g(x) are continuous at x = c, and if h(c) > 0 and g(c) = 0, then h(x) lim. will = x→c g(x) c) If lim f(x) = 0 and lim g(x) = 0 then lim f(x) does not exist. x-a x-a x→a g(x)arrow_forwardPls help ASAParrow_forward
- 15. a) Consider f(x) = x-1 3x+2 and use the difference quotient to determine the simplified expression in terms of x, for the slope of any tangent to y = f(x). Also, determine the slope at x = 2. 15 b) Determine the equation of the tangent to f(x) at x = 2. Final answer in Standard Form Ax + By + C = 0, A ≥ 0, with no fractions or decimals.arrow_forwardPls help ASAParrow_forwardPls help ASAParrow_forward
 Calculus: Early TranscendentalsCalculusISBN:9781285741550Author:James StewartPublisher:Cengage Learning
 Thomas' Calculus (14th Edition)CalculusISBN:9780134438986Author:Joel R. Hass, Christopher E. Heil, Maurice D. WeirPublisher:PEARSON
 Calculus: Early Transcendentals (3rd Edition)CalculusISBN:9780134763644Author:William L. Briggs, Lyle Cochran, Bernard Gillett, Eric SchulzPublisher:PEARSON
 Calculus: Early TranscendentalsCalculusISBN:9781319050740Author:Jon Rogawski, Colin Adams, Robert FranzosaPublisher:W. H. Freeman
 Calculus: Early Transcendental FunctionsCalculusISBN:9781337552516Author:Ron Larson, Bruce H. EdwardsPublisher:Cengage Learning


