Concept explainers
Videos
(a)
discuss the data in each
(a)
Answer to Problem 80E
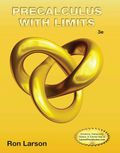
The scatter plot follows the linear model well.
Explanation of Solution
Given information:
The given graph is shown in figure (1).
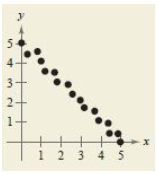
Figure (1)
Calculation:
In the given graph, the value of
From the graph, the data follows a linear model well. Hence, there is
Therefore, the scatter plot follows the linear model well.
(b)
discuss the data in each scatter plot can be approximated by linear model.
(b)
Answer to Problem 80E
The scatter plot represents a parabola shape, So, there is no co-relation.
Explanation of Solution
Given information:
The given graph is shown in figure (2).
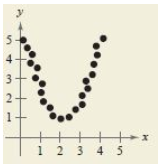
Figure (2)
Calculation:
In the given graph, the data represents a parabola shape.
From the graph, the data doesn’t shows any co-relation.
Therefore, the scatter plot represents a parabola shape, So, there is no co-relation.
(c)
discuss the data in each scatter plot can be approximated by linear model.
(c)
Answer to Problem 80E
The scatter plot follows the linear model with moderate co-relation.
Explanation of Solution
Given information:
The given graph is shown in figure (3).
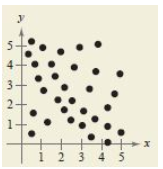
Figure (3)
Calculation:
In the given graph, the value of
From the graph, the data follows a linear model but at some points there is derivation from linear model, hence there is moderate co-relation.
Therefore, the scatter plot follows the linear model with moderate co-relation.
(d)
discuss the data in each scatter plot can be approximated by linear model.
(d)
Answer to Problem 80E
The scatter plot follows the linear model with high co-relation.
Explanation of Solution
Given information:
The given graph is shown in figure (3).
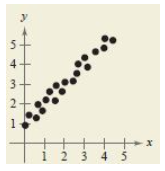
Figure (3)
Calculation:
In the given graph, the value of
From the graph, the data follows a linear model well, hence there is high co-relation.
Therefore, the scatter plot follows the linear model with high co-relation.
Chapter 1 Solutions
EBK PRECALCULUS W/LIMITS


- 1. A bicyclist is riding their bike along the Chicago Lakefront Trail. The velocity (in feet per second) of the bicyclist is recorded below. Use (a) Simpson's Rule, and (b) the Trapezoidal Rule to estimate the total distance the bicyclist traveled during the 8-second period. t 0 2 4 6 8 V 10 15 12 10 16 2. Find the midpoint rule approximation for (a) n = 4 +5 x²dx using n subintervals. 1° 2 (b) n = 8 36 32 28 36 32 28 24 24 20 20 16 16 12 8- 4 1 2 3 4 5 6 12 8 4 1 2 3 4 5 6arrow_forward= 5 37 A 4 8 0.5 06 9arrow_forwardConsider the following system of equations, Ax=b : x+2y+3z - w = 2 2x4z2w = 3 -x+6y+17z7w = 0 -9x-2y+13z7w = -14 a. Find the solution to the system. Write it as a parametric equation. You can use a computer to do the row reduction. b. What is a geometric description of the solution? Explain how you know. c. Write the solution in vector form? d. What is the solution to the homogeneous system, Ax=0?arrow_forward
- 2. Find a matrix A with the following qualities a. A is 3 x 3. b. The matrix A is not lower triangular and is not upper triangular. c. At least one value in each row is not a 1, 2,-1, -2, or 0 d. A is invertible.arrow_forwardFind the exact area inside r=2sin(2\theta ) and outside r=\sqrt(3)arrow_forwardA 20 foot ladder rests on level ground; its head (top) is against a vertical wall. The bottom of the ladder begins by being 12 feet from the wall but begins moving away at the rate of 0.1 feet per second. At what rate is the top of the ladder slipping down the wall? You may use a calculator.arrow_forward
- Explain the key points and reasons for the establishment of 12.3.2(integral Test)arrow_forwardUse 12.4.2 to determine whether the infinite series on the right side of equation 12.6.5, 12.6.6 and 12.6.7 converges for every real number x.arrow_forwarduse Cauchy Mean-Value Theorem to derive Corollary 12.6.2, and then derive 12.6.3arrow_forward
 Calculus: Early TranscendentalsCalculusISBN:9781285741550Author:James StewartPublisher:Cengage Learning
 Thomas' Calculus (14th Edition)CalculusISBN:9780134438986Author:Joel R. Hass, Christopher E. Heil, Maurice D. WeirPublisher:PEARSON
 Calculus: Early Transcendentals (3rd Edition)CalculusISBN:9780134763644Author:William L. Briggs, Lyle Cochran, Bernard Gillett, Eric SchulzPublisher:PEARSON
 Calculus: Early TranscendentalsCalculusISBN:9781319050740Author:Jon Rogawski, Colin Adams, Robert FranzosaPublisher:W. H. Freeman
 Calculus: Early Transcendental FunctionsCalculusISBN:9781337552516Author:Ron Larson, Bruce H. EdwardsPublisher:Cengage Learning