Concept explainers
Videos
(a)
Interpretation:
The hydrolysis of a 100.00-g sample of peptide forms the given individual amounts of amino acids (molar mass in g/mol are given in parentheses).
Why the total mass of amino acids exceeds the mass of peptide has to be given.
(a)
Explanation of Solution
The peptides are formed by the amino acid units. Amino acids combines together to form the amide bonds of peptides. The amide bond is formed by the loss of water molecule from
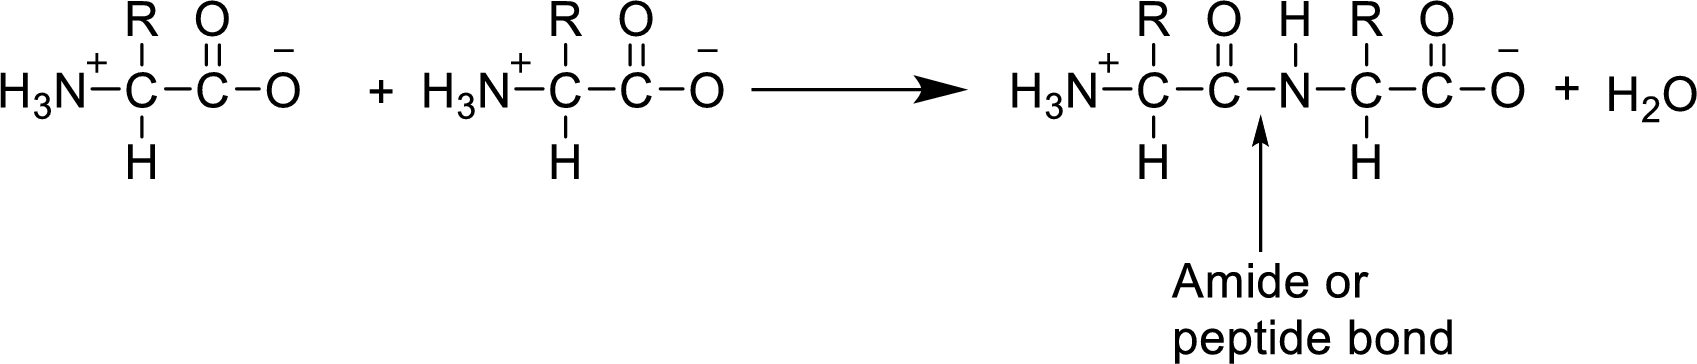
As the loss of water molecule occurs in the formation of peptide, the mass of peptide is less than that of total mass of amino acids.
(b)
Interpretation:
The hydrolysis of a 100.00-g sample of peptide forms the given individual amounts of amino acids (molar mass in g/mol are given in parentheses).
The relative numbers of amino acids in the peptide has to be given.
Concept Introduction:
The relative numbers can be calculated by converting the mass in to moles and by dividing the moles with smallest number.
(b)
Explanation of Solution
The given amounts of amino acids are
The mass of amino acids is converted to moles by using the equation
Glycine:
Alanine:
Valine:
Proline:
Serine:
Arginine:
The moles obtained can be divided by the smallest number to get the relative number.
The smallest number is
The relative numbers of amino acids are calculated.
(c)
Interpretation:
The hydrolysis of a 100.00-g sample of peptide forms the given individual amounts of amino acids (molar mass in g/mol are given in parentheses).
The minimum molar mass of the peptide has to be given.
Concept Introduction:
The minimum molar mass of peptide can be calculated by adding the products of moles of each amino acid with their molar mass to get the amount of amino acids and the water molecules mass is eliminated from the mass of amino acids to get the molar mass of peptide.
(c)
Explanation of Solution
The minimum molar mass of the peptide is calculated as
The minimum molar mass of peptide bond is calculated by subtracting the mass of water molecules from the mass of amino acids.
The minimum mass of peptide is
Want to see more full solutions like this?
Chapter 15 Solutions
Chemistry: The Molecular Nature of Matter and Change - Standalone book


- please help me with my homeworkarrow_forwardhelparrow_forwardThe temperature on a sample of pure X held at 1.25 atm and -54. °C is increased until the sample boils. The temperature is then held constant and the pressure is decreased by 0.42 atm. On the phase diagram below draw a path that shows this set of changes. pressure (atm) 2 0 0 200 400 temperature (K) Xarrow_forward
- QUESTION: Answer Question 5: 'Calculating standard error of regression' STEP 1 by filling in all the empty green boxes *The values are all provided in the photo attached*arrow_forwardpressure (atm) 3 The pressure on a sample of pure X held at 47. °C and 0.88 atm is increased until the sample condenses. The pressure is then held constant and the temperature is decreased by 82. °C. On the phase diagram below draw a path that shows this set of changes. 0 0 200 temperature (K) 400 аarrow_forwarder your payment details | bar xb Home | bartleby x + aleksogi/x/isl.exe/1o u-lgNskr7j8P3jH-1Qs_pBanHhviTCeeBZbufuBYT0Hz7m7D3ZcW81NC1d8Kzb4srFik1OUFhKMUXzhGpw7k1 O States of Matter Sketching a described thermodynamic change on a phase diagram 0/5 The pressure on a sample of pure X held at 47. °C and 0.88 atm is increased until the sample condenses. The pressure is then held constant and the temperature is decreased by 82. °C. On the phase diagram below draw a path that shows this set of changes. pressure (atm) 1 3- 0- 0 200 Explanation Check temperature (K) 400 X Q Search L G 2025 McGraw Hill LLC. All Rights Reserved Terms of Use Privacy Cearrow_forward
- 5.arrow_forward6.arrow_forward0/5 alekscgi/x/sl.exe/1o_u-IgNglkr7j8P3jH-IQs_pBaHhvlTCeeBZbufuBYTi0Hz7m7D3ZcSLEFovsXaorzoFtUs | AbtAURtkqzol 1HRAS286, O States of Matter Sketching a described thermodynamic change on a phase diagram The pressure on a sample of pure X held at 47. °C and 0.88 atm is increased until the sample condenses. The pressure is then held constant and the temperature is decreased by 82. °C. On the phase diagram below draw a path that shows this set of changes. 3 pressure (atm) + 0- 0 5+ 200 temperature (K) 400 Explanation Check X 0+ F3 F4 F5 F6 F7 S 2025 McGraw Hill LLC All Rights Reserved. Terms of Use Privacy Center Accessibility Q Search LUCR + F8 F9 F10 F11 F12 * % & ( 5 6 7 8 9 Y'S Dele Insert PrtSc + Backsarrow_forward
- 5.arrow_forward9arrow_forwardalekscgi/x/lsl.exe/1o_u-IgNslkr7j8P3jH-IQs_pBanHhvlTCeeBZbufu BYTI0Hz7m7D3ZS18w-nDB10538ZsAtmorZoFusYj2Xu9b78gZo- O States of Matter Sketching a described thermodynamic change on a phase diagram 0/5 The pressure on a sample of pure X held at 47. °C and 0.88 atm is increased until the sample condenses. The pressure is then held constant and the temperature is decreased by 82. °C. On the phase diagram below draw a path that shows this set of changes. pressure (atm) 3- 200 temperature (K) Explanation Chick Q Sowncharrow_forward
 ChemistryChemistryISBN:9781305957404Author:Steven S. Zumdahl, Susan A. Zumdahl, Donald J. DeCostePublisher:Cengage Learning
 ChemistryChemistryISBN:9781259911156Author:Raymond Chang Dr., Jason Overby ProfessorPublisher:McGraw-Hill Education
 Principles of Instrumental AnalysisChemistryISBN:9781305577213Author:Douglas A. Skoog, F. James Holler, Stanley R. CrouchPublisher:Cengage Learning
 Organic ChemistryChemistryISBN:9780078021558Author:Janice Gorzynski Smith Dr.Publisher:McGraw-Hill Education
 Chemistry: Principles and ReactionsChemistryISBN:9781305079373Author:William L. Masterton, Cecile N. HurleyPublisher:Cengage Learning
 Elementary Principles of Chemical Processes, Bind...ChemistryISBN:9781118431221Author:Richard M. Felder, Ronald W. Rousseau, Lisa G. BullardPublisher:WILEY