
Concept explainers
Videos
a.
To calculate: The median of the number of women’s teams playing a sport .
a.
Answer to Problem 22E
The median is
Explanation of Solution
Given information:
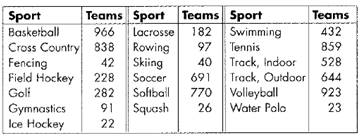
During a season, 7684n teams played 19 NCAA women’s sports.

Formula used:
Median for even terms =
Median for odd terms =
Calculation:
Consider the data in ascending order ,
Since there are seven rivers. So,
There is odd number of data.
The median of odd number of data is −
Hence, the median is
b.
To calculate: The first quartile point and the third quartile point.
b.
Answer to Problem 22E
The first quartile and third quartile are
Explanation of Solution
Given information:
During a season, 7684n teams played 19 NCAA women’s sports.

Formula used:
If each group has the median, the data is divided into four groups. Each group is called quartile.
Median for even terms =
Median for odd terms =
Calculation:
Consider the data in ascending order ,
Since there are seven rivers. So,
There is odd number of data.
The median of odd number of data is −
Therefore , the data is divided into two parts.
Lower half -
Upper half -
Median of lower half is −
Median of upper half is −
The quartile points are :-
Hence, the first quartile and third quartile are
c.
To calculate: The interquartile range and semi-interquartile range.
c.
Answer to Problem 22E
The interquartile range is
Explanation of Solution
Given information:
During a season, 7684n teams played 19 NCAA women’s sports.

Formula used:
The difference between the first quartile point and third quartile point is called the inter- quartile range.
The inter- quartile range is divided by 2, the quotient is called the semi- interquartile range.
Calculation:
Consider the data in ascending order ,
Since there are seven rivers. So,
There is odd number of data.
The median of odd number of data is
The quartile points are :-
The inter- quartile range is
The semi-interquartile range -
Hence, the interquartile range is
d.
To show: whether there is any outliers.
d.
Answer to Problem 22E
No outliers.
Explanation of Solution
Given information:
During a season, 7684n teams played 19 NCAA women’s sports.

Formula used:
Outliers are extreme values that are more than 1.5 times the interquartile range beyond the upper or lower quartiles .
Calculation:
Consider the data in ascending order ,
Since there are seven rivers. So,
There is odd number of data.
The median of odd number of data is
The quartile points are :-
The inter- quartile range is
For outlier
The lower extreme 22 and the upper extreme 966 are within the limits.
So, there are no outliers.
e.
To sketch: A box-and-whisker of the number of women’s teams playing a sport.
e.
Explanation of Solution
Given information:
During a season, 7684n teams played 19 NCAA women’s sports.

Graph:
Interpretation:
The vertical graph is known as box-and-whisker plots. It represents the number of women’s teams playing a sport. The median is 282. It does not have outliers.
f.
To calculate: The mean of the number of women’s teams playing a sport.
f.
Answer to Problem 22E
The mean is
Explanation of Solution
Given information:
During a season, 7684n teams played 19 NCAA women’s sports.

Formula used:
Formula of Mean
Calculation:
Consider the data in ascending order ,
Since there are seven rivers. So,
The mean of the data is
Hence, the mean is
g.
To calculate: The mean deviation of the data.
g.
Answer to Problem 22E
The mean deviation is
Explanation of Solution
Given information:
During a season, 7684n teams played 19 NCAA women’s sports.

Formula used:
The arithmetic mean of the absolute values of the deviations from the mean of a set of data is called the mean deviation.
Formula of Mean
Calculation:
Consider the data in ascending order ,
Since there are seven rivers. So,
The mean of the data is
The mean deviation is −
| 22 | 404.42 | |
| 23 | 404.42 | |
| 26 | 404.42 | |
| 40 | 404.42 | |
| 42 | 404.42 | |
| 91 | 404.42 | |
| 97 | 404.42 | |
| 182 | 404.42 | |
| 228 | 404.42 | |
| 282 | 404.42 | |
| 432 | 404.42 | |
| 528 | 404.42 | |
| 644 | 404.42 | |
| 691 | 404.42 | |
| 770 | 404.42 | |
| 838 | 404.42 | |
| 859 | 404.42 | |
| 923 | 404.42 | |
| 966 | 404.42 | |
Hence, the mean deviation is
h.
To calculate: The variance of the data.
h.
Answer to Problem 22E
The variance is
Explanation of Solution
Given information:
During a season, 7684n teams played 19 NCAA women’s sports.

Formula used:
A measure of variability associated with the arithmetic mean is the standard deviation.
The variance is the mean of the squares of the deviations from
The standard deviation is the positive square root of the variance.
Calculation:
Consider the data in ascending order ,
Since there are seven rivers. So,
The mean of the data is
Therefore , the standard deviation is −
| 22 | 404.42 | ||
| 23 | 404.42 | ||
| 26 | 404.42 | ||
| 40 | 404.42 | ||
| 42 | 404.42 | ||
| 91 | 404.42 | ||
| 97 | 404.42 | ||
| 182 | 404.42 | ||
| 228 | 404.42 | ||
| 282 | 404.42 | ||
| 432 | 404.42 | ||
| 528 | 404.42 | ||
| 644 | 404.42 | ||
| 691 | 404.42 | ||
| 770 | 404.42 | ||
| 838 | 404.42 | ||
| 859 | 404.42 | ||
| 923 | 404.42 | ||
| 966 | 404.42 | ||
Hence, the variance is
i.
To calculate: The standard deviation of the data.
i.
Answer to Problem 22E
The mean is
Explanation of Solution
Given information:
During a season, 7684n teams played 19 NCAA women’s sports.
Formula used:
A measure of variability associated with the arithmetic mean is the standard deviation.
Formula of Mean
Calculation:
Consider the data in ascending order ,
Since there are seven rivers. So,
The mean of the data is
Therefore , the standard deviation is −
| 22 | 404.42 | ||
| 23 | 404.42 | ||
| 26 | 404.42 | ||
| 40 | 404.42 | ||
| 42 | 404.42 | ||
| 91 | 404.42 | ||
| 97 | 404.42 | ||
| 182 | 404.42 | ||
| 228 | 404.42 | ||
| 282 | 404.42 | ||
| 432 | 404.42 | ||
| 528 | 404.42 | ||
| 644 | 404.42 | ||
| 691 | 404.42 | ||
| 770 | 404.42 | ||
| 838 | 404.42 | ||
| 859 | 404.42 | ||
| 923 | 404.42 | ||
| 966 | 404.42 | ||
Hence, the standard deviation is
j.
To discuss: The variability of the data.
j.
Explanation of Solution
Given information:
During a season, 7684n teams played 19 NCAA women’s sports.

Summary:
Variability of the data can be studied by box-and-whisker plot.
It represent the median, quartiles, interquartile range , and extreme values in a set of the data.
| Terms | 7 |
| Median | 282 |
| 42 | |
| 770 | |
| Interquartile | 728 |
| Semi-interquartile | 364 |
| Outliers | No |
Thus, the box-and-whisker drawn in previous part is a pictorial representation of the variability of the data.
Chapter 14 Solutions
Advanced Mathematical Concepts: Precalculus with Applications, Student Edition
Additional Math Textbook Solutions
Intro Stats, Books a la Carte Edition (5th Edition)
Elementary Statistics: Picturing the World (7th Edition)
A First Course in Probability (10th Edition)
Basic Business Statistics, Student Value Edition
Thinking Mathematically (6th Edition)
Calculus: Early Transcendentals (2nd Edition)


- The answer for number 1 is D Could you show me whyarrow_forwardThe path of a particle moving in a straight line is given by s = t^3 - 6t^2+ 9t + 4, where s is in ft and t in seconds. a. Finds and a when v = 0. b. Find s and v when a = 0.show the graph if needed and write the solution with a penarrow_forwardfind the roots it may help to know b =1arrow_forward
- Let m(t) be a continuous function with a domain of all real numbers. The table below shows some of the values of m(t) . Assume the characteristics of this function are represented in the table. t -3 -2 8 11 12 m(t) -7 6 3 -9 0 (a) The point (-3, -7) is on the graph of m(t). Find the corresponding point on the graph of the transformation y = -m(t) + 17. (b) The point (8, 3) is on the graph of m(t). Find the corresponding point on the graph of the transformation y = -m (−t) . 24 (c) Find f(12), if we know that f(t) = |m (t − 1)| f(12) =arrow_forwardSuppose the number of people who register to attend the Tucson Festival of Books can be modeled by P(t) = k(1.1), where t is the number of days since the registration window opened. Assume k is a positive constant. Which of the following represents how long it will take in days for the number of people who register to double? t = In(1.1) In(2) In(2) t = In(1.1) In(1.1) t = t = t = In(2) - In(k) In(2) In(k) + In(1.1) In(2) - In(k) In(1.1)arrow_forwardUse the method of washers to find the volume of the solid that is obtained when the region between the graphs f(x) = √√2 and g(x) = secx over the interval ≤x≤ is rotated about the x-axis.arrow_forward
- 5 Use the method of disks to find the volume of the solid that is obtained when the region under the curve y = over the interval [4,17] is rotated about the x-axis.arrow_forward3. Use the method of washers to find the volume of the solid that is obtained when the region between the graphs f(x) = √√2 and g(x) = secx over the interval ≤x≤ is rotated about the x-axis.arrow_forward4. Use cylindrical shells to find the volume of the solid generated when the region enclosed by the given curves is revolved about the x-axis. y = √√x, y = 0, y = √√3arrow_forward
 Calculus: Early TranscendentalsCalculusISBN:9781285741550Author:James StewartPublisher:Cengage Learning
 Thomas' Calculus (14th Edition)CalculusISBN:9780134438986Author:Joel R. Hass, Christopher E. Heil, Maurice D. WeirPublisher:PEARSON
 Calculus: Early Transcendentals (3rd Edition)CalculusISBN:9780134763644Author:William L. Briggs, Lyle Cochran, Bernard Gillett, Eric SchulzPublisher:PEARSON
 Calculus: Early TranscendentalsCalculusISBN:9781319050740Author:Jon Rogawski, Colin Adams, Robert FranzosaPublisher:W. H. Freeman
 Calculus: Early Transcendental FunctionsCalculusISBN:9781337552516Author:Ron Larson, Bruce H. EdwardsPublisher:Cengage Learning