
Concept explainers
Videos
To calculate: The inter-quartile range and the semi-interquartile range of
Answer to Problem 10E
Quartile points are
Interquartile range is
Semi- interquartile range is
Explanation of Solution
Given information:
Formula used:
If each group has the median, the data is divided into four groups. Each group is called quartile.
The difference between the first quartile point and third quartile point is called the inter- quartile range.
The inter- quartile range is divided by 2, the quotient is called the semi- interquartile range.
Median for even terms =
Median for odd terms =
Calculation:
Re-arranging the data in ascending order ,
Since , the number of terms are
So, the median is
Therefore , the data is divided into two parts.
Lower half -
Median of lower half is −
Median of upper half is −
The quartile points are :-
The inter- quartile range is
The semi-interquartile range -
Hence, the Quartile points are
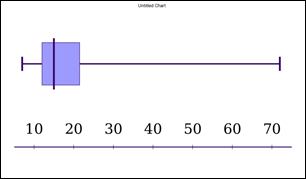
Now, using above data , sketch a box-and-whisker plot.
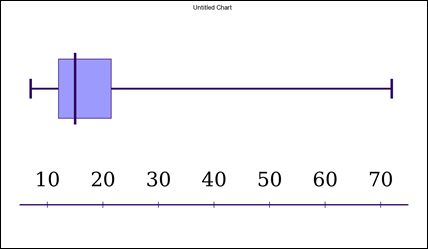
The graph represents the quartile points with median at 15.
Chapter 14 Solutions
Advanced Mathematical Concepts: Precalculus with Applications, Student Edition
Additional Math Textbook Solutions
University Calculus: Early Transcendentals (4th Edition)
Calculus: Early Transcendentals (2nd Edition)
Elementary Statistics (13th Edition)
Algebra and Trigonometry (6th Edition)
Intro Stats, Books a la Carte Edition (5th Edition)
A First Course in Probability (10th Edition)


- do number 7 plsarrow_forwardPer: Homework 5 ** This is a 2-page document! e or angle measure. Round answ 2. 3 14 0 16 x: 9022arrow_forwardx The function f is shown below. If I is the function defined by g(x) = √ ƒ(t) dt, find the value of g"(-8) in simplest form. g -1 8 y 7 10 6 LC 5 4 3 2 1 -10 -9 -8 -7 -6 -5 -4 -3 -2 -1 1 2 3 -1 -2 -3 -4 -5 56 -6 -7 -8 4 5 Graph of f 10 6 00 7 8 9 10 xarrow_forward
- The function f is shown below. If g is an antiderivative of f such that g(6) = 2, what is the maximum value of g on the closed interval [-9,9]? 8 7 6 Сл 5 4 3 1 y Graph of f -10 -9 -8 -7 -6 -5 -4 -3 -2 -1 1 23 4 -1 -2 -3 -4 -6 56 -5 -7 -8 LO 5 9 7 8 9 10arrow_forwardx The function of is shown below. If I is the function defined by g(x) = [* f(t)dt, write the equation of the line tangent to the graph of 9 at x = -3. g y Graph of f 8 7 6 5 4 32 1 x -10 -9 -8 -7 -6 -5 -4 -3 -2 -1 1 2 3 4 5 6 7 8 9 10 -1 -2 -3 56 -6 -7 -8arrow_forwardLet f(x)=4excosxf'(x)=arrow_forward
 Calculus: Early TranscendentalsCalculusISBN:9781285741550Author:James StewartPublisher:Cengage Learning
 Thomas' Calculus (14th Edition)CalculusISBN:9780134438986Author:Joel R. Hass, Christopher E. Heil, Maurice D. WeirPublisher:PEARSON
 Calculus: Early Transcendentals (3rd Edition)CalculusISBN:9780134763644Author:William L. Briggs, Lyle Cochran, Bernard Gillett, Eric SchulzPublisher:PEARSON
 Calculus: Early TranscendentalsCalculusISBN:9781319050740Author:Jon Rogawski, Colin Adams, Robert FranzosaPublisher:W. H. Freeman
 Calculus: Early Transcendental FunctionsCalculusISBN:9781337552516Author:Ron Larson, Bruce H. EdwardsPublisher:Cengage Learning