Concept explainers
(a)
To find: the range of the heights of the buildings.
(a)
Answer to Problem 12E
The range is
Explanation of Solution
Given:
Height of the tallest building in united states are:
Concept used:
Calculation:
According to the given in Ascending order is:
To calculate the range of a set of data, subtract the lowest value from highest value.
Hence, the range is
(b)
To find: the appropriate class intervals of height of the buildings.
(b)
Answer to Problem 12E
Class interval is
Explanation of Solution
Given:
Height of the tallest building in united states are:
Concept used:
Calculation:
According to the given in Ascending order is:
Class interval can be found by:
There are
Hence, class interval is
(c)
To construct: the frequency distribution table for the given heights of the building.
(c)
Answer to Problem 12E
From the frequency distribution tables the frequency can be calculated and total frequency is
Explanation of Solution
Given:
Height of the tallest building in united states are:
Concept used:
The frequency distribution table consist of frequency and tally marks which can easily measure the range class limits class size by looking at their respective blocks.
Calculation:
According to the given in Ascending order is:
The frequencies distribution table:
| Height in feet | Frequency
Tally marks | frequency |
|
| |||| |
|
|
| ||| |
|
|
| |||| |
|
|
| || |
|
|
| | |
|
|
| |||| |
|
| Total |
|
Hence, from the frequency distribution table the frequency can be calculated and total frequency is
(d)
To Graph: the frequency
(d)
Answer to Problem 12E
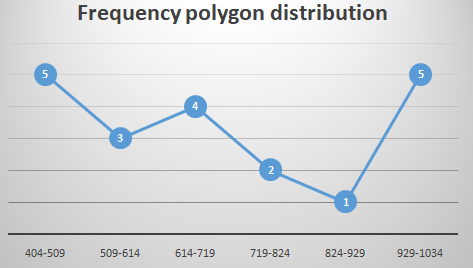
From the frequency polygon its more cleared that mention the maximum and minimum frequency through which range can be solved.
Explanation of Solution
Given:
Height of the tallest building in united states are:
Concept used:
The frequency polygons are graphical device for understanding the shapes of distributions.
The graphing device as same as histogram but specially, helpful for comparing sets of data.
Frequency polygons are also good for displaying cumulative frequency distribution.
Calculation:
According to the given in Ascending order is:
The frequency polygon of the data is:

Hence, from the frequency polygon its more cleared that mention the maximum and minimum frequency through which range can be solved.
(e)
To find: interval which represent the greatest number of the buildings.
(e)
Answer to Problem 12E
The intervals are
Explanation of Solution
Given:
Height of the tallest building in united states are:
Concept used:
The interval which has maximum of number of building can be known through highest frequency on the interval.
More is the frequency here means more is the number of buildings.
Calculation:
According to the given in Ascending order is:
The intervals
These intervals have the most building heights in them.
Hence, the intervals are
Chapter 14 Solutions
Advanced Mathematical Concepts: Precalculus with Applications, Student Edition
Additional Math Textbook Solutions
Basic Business Statistics, Student Value Edition
Introductory Statistics
Algebra and Trigonometry (6th Edition)
Pre-Algebra Student Edition
Elementary Statistics (13th Edition)
- (x)=2x-x2 2 a=2, b = 1/2, C=0 b) Vertex v F(x)=ax 2 + bx + c x= Za V=2.0L YEF(- =) = 4 b (글) JANUARY 17, 2025 WORKSHEET 1 Solve the following four problems on a separate sheet. Fully justify your answers to MATH 122 ล T earn full credit. 1. Let f(x) = 2x- 1x2 2 (a) Rewrite this quadratic function in standard form: f(x) = ax² + bx + c and indicate the values of the coefficients: a, b and c. (b) Find the vertex V, focus F, focal width, directrix D, and the axis of symmetry for the graph of y = f(x). (c) Plot a graph of y = f(x) and indicate all quantities found in part (b) on your graph. (d) Specify the domain and range of the function f. OUR 2. Let g(x) = f(x) u(x) where f is the quadratic function from problem 1 and u is the unit step function: u(x) = { 0 1 if x ≥0 0 if x<0 y = u(x) 0 (a) Write a piecewise formula for the function g. (b) Sketch a graph of y = g(x). (c) Indicate the domain and range of the function g. X фирм where u is the unit step function defined in problem 2. 3. Let…arrow_forwardQuestion 1arrow_forward"P3 Question 3: Construct the accessibility matrix Passociated with the following graphs, and compute P2 and identify each at the various two-step paths in the graph Ps P₁ P₂arrow_forward
- A cable television company estimates that with x thousand subscribers, its monthly revenue and cost (in thousands of dollars) are given by the following equations. R(x) = 45x - 0.24x2 C(x) = 257 + 13xarrow_forwardx³-343 If k(x) = x-7 complete the table and use the results to find lim k(x). X-7 x 6.9 6.99 6.999 7.001 7.01 7.1 k(x) Complete the table. X 6.9 6.99 6.999 7.001 7.01 7.1 k(x) (Round to three decimal places as needed.)arrow_forward(3) (4 points) Given three vectors a, b, and c, suppose: |bx c = 2 |a|=√√8 • The angle between a and b xc is 0 = 135º. . Calculate the volume a (bxc) of the parallelepiped spanned by the three vectors.arrow_forward
- Calculate these limits. If the limit is ∞ or -∞, write infinity or-infinity. If the limit does not exist, write DNE: Hint: Remember the first thing you check when you are looking at a limit of a quotient is the limit value of the denominator. 1. If the denominator does not go to 0, you should be able to right down the answer immediately. 2. If the denominator goes to 0, but the numerator does not, you will have to check the sign (±) of the quotient, from both sides if the limit is not one-sided. 3. If both the numerator and the denominator go to 0, you have to do the algebraic trick of rationalizing. So, group your limits into these three forms and work with them one group at a time. (a) lim t-pi/2 sint-√ sin 2t+14cos ² t 7 2 2 2cos t (b) lim sint + sin 2t+14cos = ∞ t-pi/2 2 2cos t (c) lim cost-√sin 2t+14cos² t = t-pi/2 2cos t (d) lim t→pi/2 cost+√ sin t + 14cos 2cos ² t = ∞ (e) lim sint-v sin 2 t + 14cos = 0 t-pi/2 (f) lim t-pi/2 sin t +√ sin 2sin 2 t 2 t + 14cos t 2sin t cost- (g)…arrow_forwardThink of this sheet of paper as the plane containing the vectors a = (1,1,0) and b = (2,0,0). Sketch the parallelogram P spanned by a and b. Which diagonal of P represents the vector a--b geometrically?arrow_forward(1) (14 points) Let a = (-2, 10, -4) and b = (3, 1, 1). (a) (4 points) Using the dot product determine the angle between a and b. (b) (2 points) Determine the cross product vector axb. (c) (4 points) Calculate the area of the parallelogram spanned by a and b. Justify your answer. 1arrow_forward
- (d) (4 points) Think of this sheet of paper as the plane containing the vectors a = (1,1,0) and b = (2,0,0). Sketch the parallelogram P spanned by a and b. Which diagonal of P represents the vector ab geometrically? d be .dx adjarrow_forward(2) (4 points) Find all vectors v having length 1 that are perpendicular to both =(2,0,2) and j = (0,1,0). Show all work. a=arrow_forwardFor the following function, find the full power series centered at a of convergence. 0 and then give the first 5 nonzero terms of the power series and the open interval = f(2) Σ 8 1(x)--(-1)*(3)* n=0 ₤(x) = + + + ++... The open interval of convergence is: 1 1 3 f(x)= = 28 3x6 +1 (Give your answer in help (intervals) .)arrow_forward
 Calculus: Early TranscendentalsCalculusISBN:9781285741550Author:James StewartPublisher:Cengage Learning
 Thomas' Calculus (14th Edition)CalculusISBN:9780134438986Author:Joel R. Hass, Christopher E. Heil, Maurice D. WeirPublisher:PEARSON
 Calculus: Early Transcendentals (3rd Edition)CalculusISBN:9780134763644Author:William L. Briggs, Lyle Cochran, Bernard Gillett, Eric SchulzPublisher:PEARSON
 Calculus: Early TranscendentalsCalculusISBN:9781319050740Author:Jon Rogawski, Colin Adams, Robert FranzosaPublisher:W. H. Freeman
 Calculus: Early Transcendental FunctionsCalculusISBN:9781337552516Author:Ron Larson, Bruce H. EdwardsPublisher:Cengage Learning


