
Concept explainers
Videos
(a)
To find: The range of the grams of fat in various sandwiched served by national fast food restaurants.
(a)
Answer to Problem 10E
The range is
Explanation of Solution
Given:
The gram of fats:
Concept used:
Calculation:
According to the given in Ascending order is:
To calculate the range of a set of data, subtract the lowest value from highest value.
Hence, the range is
(b)
To find: the appropriate class intervals of gram of fats.
(b)
Answer to Problem 10E
Class interval is
Explanation of Solution
Given:
The gram of fats:
Concept used:
Calculation:
According to the given in Ascending order is:
Class interval can be found by:
Hence, class interval is
(c)
To find: the class limit of a gram of fats which are listed below.
(c)
Answer to Problem 10E
Class limits are
Explanation of Solution
Given:
The gram of fats:
Concept used:
The class limit are lower limit and upper limit.
Intervals of the class is always same.
Calculation:
According to the given in Ascending order is:
The class limit are lower limit and upper limit of the class size since, the class size is
Hence, the class limits are
(d)
To find: The class marks of the gram of fat given below.
(d)
Answer to Problem 10E
Class marks are
Explanation of Solution
Given:
The gram of fats:
Concept used:
Class marks are the mid value or mid-point of every interval.
Calculation:
According to the given in Ascending order is:
Class marks are the mid value or mid-point of every interval.
Since, class limits are:
For the first interval the class marks:
Similarly, it can be used to find the class mark respective class intervals or add
Hence, class marks are
(e)
To construct: the frequency distribution table for the gram o fats given below.
(e)
Answer to Problem 10E
The frequency distribution table the frequency can be calculated and total frequency is
Explanation of Solution
Given:
The gram of fats:
Concept used:
The frequency distribution table consist of frequency and tally marks which can easily measure the range class limits class size by looking at their respective blocks.
Calculation:
According to the given in Ascending order is:
(f)
To graph: the histogram from the grams of fats listed below.
(f)
Answer to Problem 10E
From histogram its more cleared to mention the maximum and minimum frequency through which range can be solved.
Explanation of Solution
Given:
The gram of fats:
Concept used:
The histogram chart can be draw through Microsoft excel and this histogram chart can give so many information regarding the data.
The histogram is most commonly used graph to show frequency distributions
The purpose of histogram is to graphically summarize the distribution of a univariate data set.
Calculation:
According to the given in Ascending order is:
The histogram chart for the
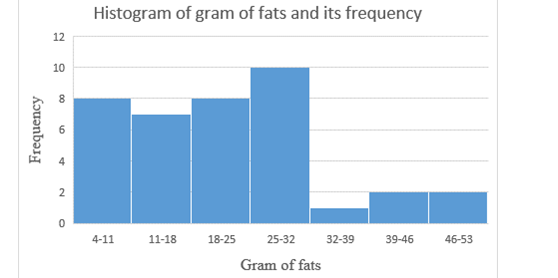
Hence, from histogram its more cleared to mention the maximum and minimum frequency through which range can be solved.
(g)
To find: the intervals that describe the most fat contained in sandwiches.
(g)
Answer to Problem 10E
Explanation of Solution
Given:
The gram of fats:
Concept used:
The histogram chart can be draw through Microsoft excel and this histogram chart can give so many information regarding the data.
The histogram is most commonly used graph to show frequency distributions
The purpose of histogram is to graphically summarize the distribution of a univariate data set.
Calculation:
According to the given in Ascending order is:
From the help of histogram chart the largest frequency can be measured as:
Hence, interval is
Chapter 14 Solutions
Advanced Mathematical Concepts: Precalculus with Applications, Student Edition
Additional Math Textbook Solutions
Basic Business Statistics, Student Value Edition
University Calculus: Early Transcendentals (4th Edition)
Introductory Statistics
Calculus: Early Transcendentals (2nd Edition)
College Algebra with Modeling & Visualization (5th Edition)
Algebra and Trigonometry (6th Edition)


- i need help pleasearrow_forward(#1) Consider the solid bounded below by z = x² and above by z = 4-y². If we were to project this solid down onto the xy-plane, you should be able to use algebra to determine the 2D region R in the xy-plane for the purposes of integration. Which ONE of these limite of integration would correctly describe R? (a) y: x24x: -22 - (b) y: 22 x: 04-y² (c) y: -√√4-x2. →√√4x²x: −2 → 2 (d) z: 24-y² y: -2 → 2 (e) None of the abovearrow_forwardX MindTap - Cenxxxx Answered: tat "X A 26308049 X 10 EKU-- SP 25: X E DNA Sequenc X b/ui/evo/index.html?elSBN=9780357038406&id=339416021&snapshotid=877369& GE MINDTAP , Limits, and the Derivative 40. Answer 5 4-5 t-10 5 f(x) = 2x - 4 if x ≤0 if x 0 10 ++ -4-3-2-1 f(x) = MacBook Pro Search or type URL 5 1234 x² +1 if x = 0 if x = 0 +arrow_forward
- MindTap - Cemy X Answered: tat x A 26308049 × 10 EKU--SP 25:11 × E DNA Sequence x H. pylori index.html?elSBN=9780357038406&id=339416021&snapshotid=877369& NDTAP and the Derivative 41. 42. Answer 12 Ay 5 + -10-5 5 10 -5- f(x) = x +5 if x ≤ 0 -x²+5 if x > 0 to -5 5. 5 f(x) = |x − 1| MacBook Pro AAarrow_forwardMind Tap - Cenxxx Answered: tat X A 26308049 × 10 EKU-- SP 25: X E DNA Sequence x H. pylor vo/index.html?elSBN=9780357038406&id=339416021&snapshotld=877369& MINDTAP its, and the Derivative 44. Answer 5 X -10-5 5 10 -5. f(x) = 2 + x +5 if x 0 3 4 f(x) = x² - 1 x+1 if x = -1 MacBook Pro G Search or type URL if x = -1 + AA aarrow_forwardCalculus lll May I please have an explanation of the multivariable chain rule in the example given? Thank youarrow_forward
- Mind Tap - Cenxxx Answered: tat X A 26308049 X 10 EKU-- SP 25:1 x E DNA Sequence x H. pyl /nb/ui/evo/index.html?elSBN 9780357038406&id=339416021&snapshotid=877369& ⭑ SAGE MINDTAP a ons, Limits, and the Derivative 吃 AA In Exercises 45, 46, 47, 48, 49, 50, 51, 52, 53, 54, 55, and 56, find the values of x for which each function is continuous. 45. f(x) = 2x²+x-1 Answer▾ 46. f(x) = x³- 2x²+x-1 47. f(x) 2 = x²+1 Answer 48. f(x) = 49. f(x) = Answer 50. f(x) = 51. f(x) = I 2x²+1 2 2x - 1 x+1 x-1 2x + 1 x²+x-2 Answer↓ 52. f(x)= = x-1 x2+2x-3 53. $ % MacBook Proarrow_forward37. lim f (x) and lim f (x), where x+0+ x 0 Answer -> 38. lim f (x) and lim f (x), where +0x x―0M 2x if x 0arrow_forward37. lim f (x) and lim f (x), where x+0+ x 0 Answer -> 38. lim f (x) and lim f (x), where +0x x―0M 2x if x 0arrow_forward
- Apply the Chain Rulearrow_forwardCalculus lll May I please have the solution for the following exercise? Thank youarrow_forward2z = el+cos(x+y) 24 = olt etz dy = 1 dt dz e²² + cos (+²+1++). 2++ (1+++cos C+²+1++) (+) dz 2+. etz 2t, + 2+⋅ cos (t² +++ 1) + t (1++1 dt + cos (+²+++1) 2. W= (yz) (yz) x x=e8++ 2 y= 3² + 3st, z=sent, hallar 2w 2w د 2u 2t 25 2t AX119 S Narrow_forward
 Calculus: Early TranscendentalsCalculusISBN:9781285741550Author:James StewartPublisher:Cengage Learning
 Thomas' Calculus (14th Edition)CalculusISBN:9780134438986Author:Joel R. Hass, Christopher E. Heil, Maurice D. WeirPublisher:PEARSON
 Calculus: Early Transcendentals (3rd Edition)CalculusISBN:9780134763644Author:William L. Briggs, Lyle Cochran, Bernard Gillett, Eric SchulzPublisher:PEARSON
 Calculus: Early TranscendentalsCalculusISBN:9781319050740Author:Jon Rogawski, Colin Adams, Robert FranzosaPublisher:W. H. Freeman
 Calculus: Early Transcendental FunctionsCalculusISBN:9781337552516Author:Ron Larson, Bruce H. EdwardsPublisher:Cengage Learning