
Statistics for Business and Economics (13th Edition)
13th Edition
ISBN: 9780134506593
Author: James T. McClave, P. George Benson, Terry Sincich
Publisher: PEARSON
expand_more
expand_more
format_list_bulleted
Videos
Textbook Question
Chapter 14.2, Problem 14.19ACI
Yearly price of gold. The price of gold is used by some financial analysts as a barometer of investors’ expectations of inflation, with the price of gold tending to increase as concerns about inflation increase. The table below shows the average annual price of gold (in dollars per ounce) from 1990 through 2015.
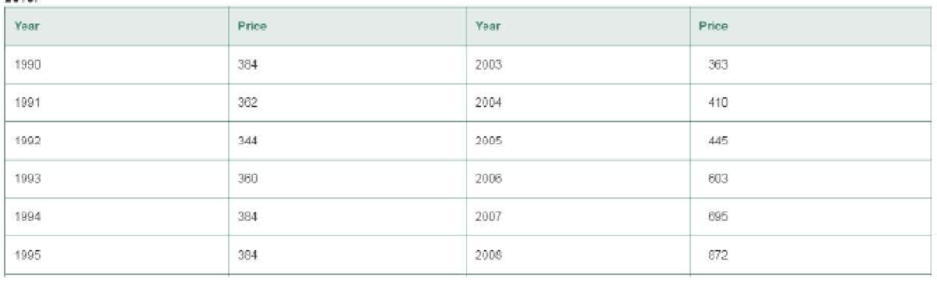
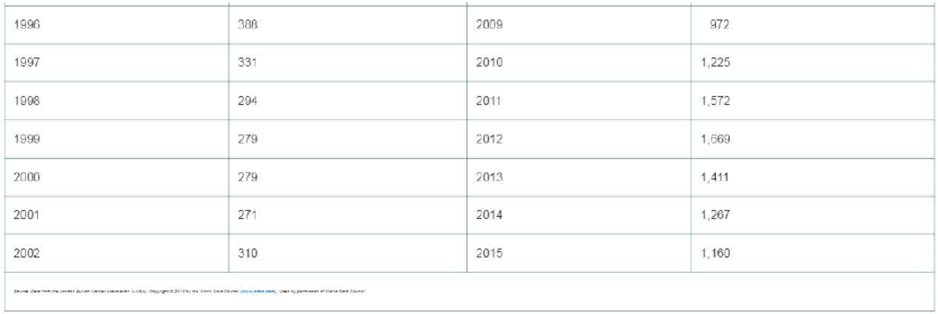
a. Compute an exponentially smoothed series for the gold price time series for the period from 1990 to 2015, using a smoothing coefficient of w = .8.
b. Plot the original series and the exponentially smoothed series on the same graph. Comment on the trend observed.
Expert Solution & Answer
Want to see the full answer?
Check out a sample textbook solution
Students have asked these similar questions
2.2, 13.2-13.3)
question: 5 point(s) possible
ubmit test
The accompanying table contains the data for the amounts (in oz) in cans of a certain soda. The cans are labeled to indicate that the contents are 20 oz of soda. Use the sign test and
0.05 significance level to test the claim that cans of this soda are filled so that the median amount is 20 oz. If the median is not 20 oz, are consumers being cheated?
Click the icon to view the data.
What are the null and alternative hypotheses?
OA. Ho: Medi
More Info
H₁: Medi
OC. Ho: Medi
H₁: Medi
Volume (in ounces)
20.3
20.1
20.4
Find the test stat
20.1
20.5
20.1
20.1
19.9
20.1
Test statistic =
20.2
20.3
20.3
20.1
20.4
20.5
Find the P-value
19.7
20.2
20.4
20.1
20.2
20.2
P-value=
(R
19.9
20.1
20.5
20.4
20.1
20.4
Determine the p
20.1
20.3
20.4
20.2
20.3
20.4
Since the P-valu
19.9
20.2
19.9
Print
Done
20 oz
20 oz
20 oz
20 oz
ce that the consumers are being cheated.
T
Teenage obesity (O), and weekly fast-food meals (F), among some selected Mississippi teenagers are:
Name Obesity (lbs) # of Fast-foods per week
Josh
185
10
Karl
172
8
Terry
168
9
Kamie
Andy
204
154
12
6
(a) Compute the variance of Obesity, s²o, and the variance of fast-food meals, s², of this data. [Must show full work].
(b) Compute the Correlation Coefficient between O and F. [Must show full work].
(c) Find the Coefficient of Determination between O and F. [Must show full work].
(d) Obtain the Regression equation of this data. [Must show full work].
(e) Interpret your answers in (b), (c), and (d). (Full explanations required).
Edit View Insert Format Tools Table
The average miles per gallon for a sample of 40 cars of model SX last year was 32.1, with a population standard deviation of 3.8. A sample of 40 cars from this year’s model SX has an average of 35.2 mpg, with a population standard deviation of 5.4.
Find a 99 percent confidence interval for the difference in average mpg for this car brand (this year’s model minus last year’s).Find a 99 percent confidence interval for the difference in average mpg for last year’s model minus this year’s. What does the negative difference mean?
Chapter 14 Solutions
Statistics for Business and Economics (13th Edition)
Ch. 14.1 - Explain in words how to construct a simple index.Ch. 14.1 - Explain in words how to calculate the following...Ch. 14.1 - Explain in words the difference between Laspeyres...Ch. 14.1 - The table below gives the prices for three...Ch. 14.1 - Refer to Exercise 14.4. The next table gives the...Ch. 14.1 - Annual median family income. The table below lists...Ch. 14.1 - Annual U.S. craft beer production. While overall...Ch. 14.1 - Quarterly single-family housing starts. The...Ch. 14.1 - Spot price of natural gas. The table shown in the...Ch. 14.1 - Employment in farm and nonfarm categories....
Ch. 14.1 - GOP personal consumption expenditures. The gross...Ch. 14.1 - GDP personal consumption expenditures (contd)....Ch. 14.1 - Weekly earnings for workers. The table in the next...Ch. 14.1 - Production and price of metals. The level or price...Ch. 14.2 - Describe the effect of selecting an exponential...Ch. 14.2 - A monthly time series is shown in the table to the...Ch. 14.2 - Annual U.S. craft beer production. Refer to the...Ch. 14.2 - Foreign fish production. Overfishing and pollution...Ch. 14.2 - Yearly price of gold. The price of gold is used by...Ch. 14.2 - Personal consumption in transportation. There has...Ch. 14.2 - OPEC crude oil imports. The data in the table...Ch. 14.2 - SP 500 Stock Index. Standard Poors 500 Composite...Ch. 14.5 - How does the choice of the smoothing constant w...Ch. 14.5 - Refer to Exercise 14.4 (p. 14-9). The table with...Ch. 14.5 - Annual U.S. craft beer production. Refer to...Ch. 14.5 - Quarterly single-family housing starts. Refer to...Ch. 14.5 - Consumer Price Index. The CPI measures the...Ch. 14.5 - OPEC crude oil imports. Refer to the annual OPEC...Ch. 14.5 - SP 500 Stock Index. Refer to the quarterly...Ch. 14.5 - SP 500 Stock Index (contd). Refer to Exercise...Ch. 14.5 - Monthly gold prices. The fluctuation of gold...Ch. 14.6 - Annual U.S. craft beer production. Refer to the...Ch. 14.6 - Annual U.S. craft beer production (contd). Refer...Ch. 14.6 - SP 500 Stock Index. Refer to your exponential...Ch. 14.6 - SP 500 Stock Index (contd). Refer to your Holt...Ch. 14.6 - Monthly gold prices. Refer to the monthly gold...Ch. 14.6 - US school enrollments. The next table reports...Ch. 14.8 - The annual price of a finished product (in cents...Ch. 14.8 - Retail sales in Quarters 14 over a 10-year period...Ch. 14.8 - What advantage do regression forecasts have over...Ch. 14.8 - Mortgage interest rates. The level at which...Ch. 14.8 - Price of natural gas. Refer to Exercise 14.9 (p....Ch. 14.8 - A gasoline tax on carbon emissions. In an effort...Ch. 14.8 - Predicting presidential elections. Researchers at...Ch. 14.8 - Life insurance policies in force. The table below...Ch. 14.8 - Graphing calculator sales. The next table presents...Ch. 14.8 - Prob. 14.47ACICh. 14.9 - Define autocorrelation. Explain why it is...Ch. 14.9 - For each case, indicate the decision regarding the...Ch. 14.9 - What do the following Durbin-Watson statistics...Ch. 14.9 - Company donations to charity. Refer to the Journal...Ch. 14.9 - Forecasting monthly car and truck sales. Forecasts...Ch. 14.9 - Predicting presidential elections. Refer to the...Ch. 14.9 - Mortgage interest rates. Refer to the data on...Ch. 14.9 - Price of natural gas. Refer to the annual data on...Ch. 14.9 - Life insurance policies in force. Refer to the...Ch. 14.9 - Modeling the deposit share of a retail bank....Ch. 14 - Insured Social Security workers. Workers insured...Ch. 14 - Insured Social Security workers (contd). Refer to...Ch. 14 - Retail prices of food items. In 1990, the average...Ch. 14 - Demand for emergency room services. With the...Ch. 14 - Mortgage interest rates. Refer to the annual...Ch. 14 - Price of Abbott Labs stock. The yearly closing...Ch. 14 - Price o f Abbott Labs stock (contd). Refer to...Ch. 14 - Prob. 14.65ACICh. 14 - Prob. 14.66ACICh. 14 - Quarterly GOP values (contd). Refer to Exercise...Ch. 14 - Prob. 14.68ACICh. 14 - Prob. 14.69ACICh. 14 - Prob. 14.70ACICh. 14 - IBM stock prices. Refer to Example 14.1 (p. 14-5)...Ch. 14 - Prob. 14.72ACI
Knowledge Booster


Learn more about
Need a deep-dive on the concept behind this application? Look no further. Learn more about this topic, statistics and related others by exploring similar questions and additional content below.Similar questions
- A special interest group reports a tiny margin of error (plus or minus 0.04 percent) for its online survey based on 50,000 responses. Is the margin of error legitimate? (Assume that the group’s math is correct.)arrow_forwardSuppose that 73 percent of a sample of 1,000 U.S. college students drive a used car as opposed to a new car or no car at all. Find an 80 percent confidence interval for the percentage of all U.S. college students who drive a used car.What sample size would cut this margin of error in half?arrow_forwardYou want to compare the average number of tines on the antlers of male deer in two nearby metro parks. A sample of 30 deer from the first park shows an average of 5 tines with a population standard deviation of 3. A sample of 35 deer from the second park shows an average of 6 tines with a population standard deviation of 3.2. Find a 95 percent confidence interval for the difference in average number of tines for all male deer in the two metro parks (second park minus first park).Do the parks’ deer populations differ in average size of deer antlers?arrow_forward
- Suppose that you want to increase the confidence level of a particular confidence interval from 80 percent to 95 percent without changing the width of the confidence interval. Can you do it?arrow_forwardA random sample of 1,117 U.S. college students finds that 729 go home at least once each term. Find a 98 percent confidence interval for the proportion of all U.S. college students who go home at least once each term.arrow_forwardSuppose that you make two confidence intervals with the same data set — one with a 95 percent confidence level and the other with a 99.7 percent confidence level. Which interval is wider?Is a wide confidence interval a good thing?arrow_forward
- Is it true that a 95 percent confidence interval means you’re 95 percent confident that the sample statistic is in the interval?arrow_forwardTines can range from 2 to upwards of 50 or more on a male deer. You want to estimate the average number of tines on the antlers of male deer in a nearby metro park. A sample of 30 deer has an average of 5 tines, with a population standard deviation of 3. Find a 95 percent confidence interval for the average number of tines for all male deer in this metro park.Find a 98 percent confidence interval for the average number of tines for all male deer in this metro park.arrow_forwardBased on a sample of 100 participants, the average weight loss the first month under a new (competing) weight-loss plan is 11.4 pounds with a population standard deviation of 5.1 pounds. The average weight loss for the first month for 100 people on the old (standard) weight-loss plan is 12.8 pounds, with population standard deviation of 4.8 pounds. Find a 90 percent confidence interval for the difference in weight loss for the two plans( old minus new) Whats the margin of error for your calculated confidence interval?arrow_forward
- A 95 percent confidence interval for the average miles per gallon for all cars of a certain type is 32.1, plus or minus 1.8. The interval is based on a sample of 40 randomly selected cars. What units represent the margin of error?Suppose that you want to decrease the margin of error, but you want to keep 95 percent confidence. What should you do?arrow_forward3. (i) Below is the R code for performing a X2 test on a 2×3 matrix of categorical variables called TestMatrix: chisq.test(Test Matrix) (a) Assuming we have a significant result for this procedure, provide the R code (including any required packages) for an appropriate post hoc test. (b) If we were to apply this technique to a 2 × 2 case, how would we adapt the code in order to perform the correct test? (ii) What procedure can we use if we want to test for association when we have ordinal variables? What code do we use in R to do this? What package does this command belong to? (iii) The following code contains the initial steps for a scenario where we are looking to investigate the relationship between age and whether someone owns a car by using frequencies. There are two issues with the code - please state these. Row3<-c(75,15) Row4<-c(50,-10) MortgageMatrix<-matrix(c(Row1, Row4), byrow=T, nrow=2, MortgageMatrix dimnames=list(c("Yes", "No"), c("40 or older","<40")))…arrow_forwardDescribe the situation in which Fisher’s exact test would be used?(ii) When do we use Yates’ continuity correction (with respect to contingencytables)?[2 Marks] 2. Investigate, checking the relevant assumptions, whether there is an associationbetween age group and home ownership based on the sample dataset for atown below:Home Owner: Yes NoUnder 40 39 12140 and over 181 59Calculate and evaluate the effect size.arrow_forward
arrow_back_ios
SEE MORE QUESTIONS
arrow_forward_ios
Recommended textbooks for you

 College AlgebraAlgebraISBN:9781305115545Author:James Stewart, Lothar Redlin, Saleem WatsonPublisher:Cengage Learning
 Algebra and Trigonometry (MindTap Course List)AlgebraISBN:9781305071742Author:James Stewart, Lothar Redlin, Saleem WatsonPublisher:Cengage Learning
 Functions and Change: A Modeling Approach to Coll...AlgebraISBN:9781337111348Author:Bruce Crauder, Benny Evans, Alan NoellPublisher:Cengage Learning
College Algebra
Algebra
ISBN:9781305115545
Author:James Stewart, Lothar Redlin, Saleem Watson
Publisher:Cengage Learning
Algebra and Trigonometry (MindTap Course List)
Algebra
ISBN:9781305071742
Author:James Stewart, Lothar Redlin, Saleem Watson
Publisher:Cengage Learning
Functions and Change: A Modeling Approach to Coll...
Algebra
ISBN:9781337111348
Author:Bruce Crauder, Benny Evans, Alan Noell
Publisher:Cengage Learning
Time Series Analysis Theory & Uni-variate Forecasting Techniques; Author: Analytics University;https://www.youtube.com/watch?v=_X5q9FYLGxM;License: Standard YouTube License, CC-BY
Operations management 101: Time-series, forecasting introduction; Author: Brandoz Foltz;https://www.youtube.com/watch?v=EaqZP36ool8;License: Standard YouTube License, CC-BY