
Concept explainers
Videos
Insured Social Security workers. Workers insured under the Social Security program are categorized as fully and permanently insured, fully but not permanently insured, or insured in the
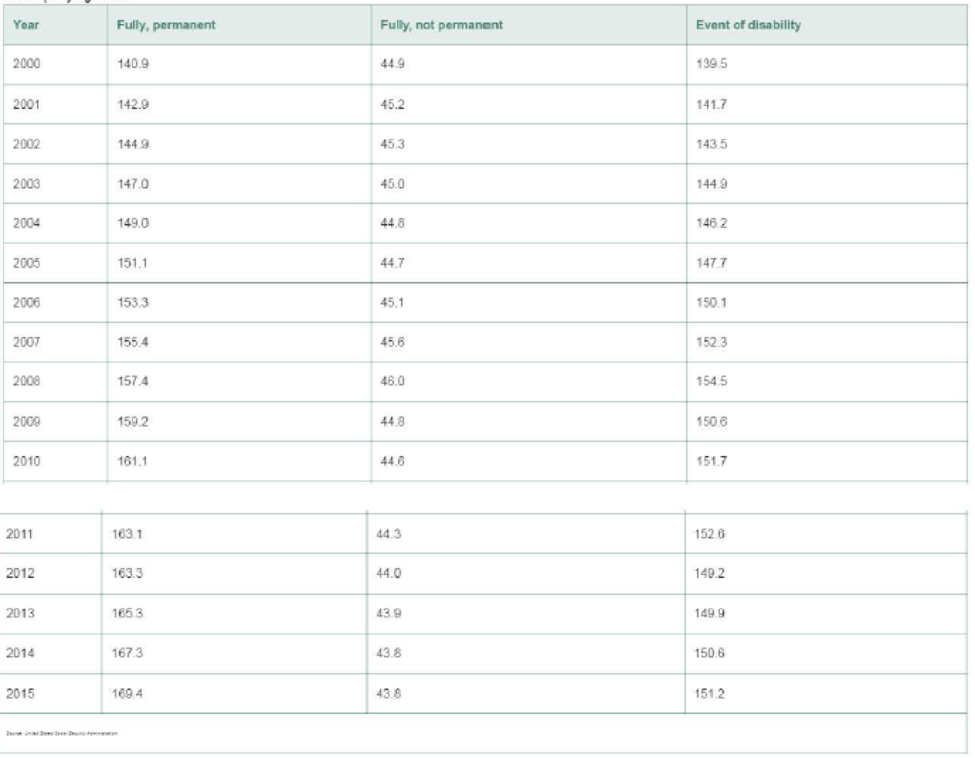
a. Compute a simple composite index for the number of workers in the three insured categories using 2000 as the base period.
b. Is the index, part a, a price index or a quantity index?
c. Refer to part a. Interpret the index value for 2015.
a.
To compute: The simple composite index for the number of workers in the three insured categories using 2000 as the base period.
Answer to Problem 14.58ACB
The simple composite index for the number of workers in the three insured categories using 2000 as the base period is,
| Year | Fully Permanent | Fully Not Permanent | Event Disability | Index |
| 2000 | 140.9 | 44.9 | 139.5 | 100.0 |
| 2001 | 142.9 | 45.2 | 141.7 | 101.4 |
| 2002 | 144.9 | 45.3 | 143.5 | 102.6 |
| 2003 | 147 | 45 | 144.9 | 103.6 |
| 2004 | 149 | 44.8 | 146.2 | 104.5 |
| 2005 | 151.1 | 44.7 | 147.7 | 105.6 |
| 2006 | 153.3 | 45.1 | 150.1 | 107.1 |
| 2007 | 155.4 | 45.6 | 152.3 | 108.6 |
| 2008 | 157.4 | 46 | 154.5 | 110.0 |
| 2009 | 159.2 | 44.8 | 150.6 | 109.0 |
| 2010 | 161.1 | 44.6 | 151.7 | 109.9 |
| 2011 | 163.1 | 44.3 | 152.6 | 110.7 |
| 2012 | 163.3 | 44 | 149.2 | 109.6 |
| 2013 | 165.3 | 43.9 | 149.9 | 110.4 |
| 2014 | 167.3 | 43.8 | 150.6 | 111.2 |
| 2015 | 169.4 | 43.8 | 151.2 | 112.0 |
Explanation of Solution
Given info:
The table shows that the number of workers in different categories from 2000 to 2015.
Calculation:
The total number of workers in fully and permanently insured, fully but not permanently insured or insured in the event of disability of the years 2000-2015 is obtained as follows:
The total number of workers in fully and permanently insured, fully but not permanently insured or insured in the event of disability of the 2000 is obtained by adding the number of workers in fully and permanently insured, fully but not permanently insured or insured in the event of disability of the year 2000.
Similarly the totals of the remaining years 2001-2015 is as follows:
| Year | Fully Permanent | Fully Not Permanent | Event Disability | Sum |
| 2000 | 140.9 | 44.9 | 139.5 | 325.3 |
| 2001 | 142.9 | 45.2 | 141.7 | 329.8 |
| 2002 | 144.9 | 45.3 | 143.5 | 333.7 |
| 2003 | 147 | 45 | 144.9 | 336.9 |
| 2004 | 149 | 44.8 | 146.2 | 340.0 |
| 2005 | 151.1 | 44.7 | 147.7 | 343.5 |
| 2006 | 153.3 | 45.1 | 150.1 | 348.5 |
| 2007 | 155.4 | 45.6 | 152.3 | 353.3 |
| 2008 | 157.4 | 46 | 154.5 | 357.9 |
| 2009 | 159.2 | 44.8 | 150.6 | 354.6 |
| 2010 | 161.1 | 44.6 | 151.7 | 357.4 |
| 2011 | 163.1 | 44.3 | 152.6 | 360.0 |
| 2012 | 163.3 | 44 | 149.2 | 356.5 |
| 2013 | 165.3 | 43.9 | 149.9 | 359.1 |
| 2014 | 167.3 | 43.8 | 150.6 | 361.7 |
| 2015 | 169.4 | 43.8 | 151.2 | 364.4 |
The formula to find the simple composite index is,
For year 2000:
The simple composite index for the number of workers in the three insured categories for year 2000 using 2000 as the base period is as follows:
Substitute 325.3 for “Sum value at time t” and 325.3 for “Time series value at base period”
Similarly, the simple composite index for the remaining years using 2000 as the base year is as follows:
| Year | Fully Permanent | Fully Not Permanent | Event Disability | Sum | Simple Composite Index-2000 |
| 2000 | 140.9 | 44.9 | 139.5 | 325.3 | 100.0 |
| 2001 | 142.9 | 45.2 | 141.7 | 329.8 | 101.4 |
| 2002 | 144.9 | 45.3 | 143.5 | 333.7 | 102.6 |
| 2003 | 147 | 45 | 144.9 | 336.9 | 103.6 |
| 2004 | 149 | 44.8 | 146.2 | 340.0 | 104.5 |
| 2005 | 151.1 | 44.7 | 147.7 | 343.5 | 105.6 |
| 2006 | 153.3 | 45.1 | 150.1 | 348.5 | 107.1 |
| 2007 | 155.4 | 45.6 | 152.3 | 353.3 | 108.6 |
| 2008 | 157.4 | 46 | 154.5 | 357.9 | 110.0 |
| 2009 | 159.2 | 44.8 | 150.6 | 354.6 | 109.0 |
| 2010 | 161.1 | 44.6 | 151.7 | 357.4 | 109.9 |
| 2011 | 163.1 | 44.3 | 152.6 | 360.0 | 110.7 |
| 2012 | 163.3 | 44 | 149.2 | 356.5 | 109.6 |
| 2013 | 165.3 | 43.9 | 149.9 | 359.1 | 110.4 |
| 2014 | 167.3 | 43.8 | 150.6 | 361.7 | 111.2 |
| 2015 | 169.4 | 43.8 | 151.2 | 364.4 | 112.0 |
b.
To identify: Whether the index in part (a) is price index or quantity index.
Answer to Problem 14.58ACB
The index in part (a) is quantity index.
Explanation of Solution
Justification:
From the given information it can be observed that the index in part (a) represents the quantities. Thus, the index in part (a) is quantity index.
c.
To interpret: The index value for 2015.
Answer to Problem 14.58ACB
The index value for 2015 interprets that the total number of insured workers in 2015 is increased by 12.0% when the base year is 2000.
Explanation of Solution
Justification:
Here, it is observed that the total number of insured workers in 2015 is increased by 12.0%
Want to see more full solutions like this?
Chapter 14 Solutions
Statistics for Business and Economics (13th Edition)


- Not use ai pleasearrow_forwardThe African Continental Free Trade Area is a key strategic agreement undertaken by the African Union in recent years. Choose a case from amongst the countries listed below and discuss the challenges and opportunities which exist for this country in entering into this agreement. You can choose a particular industry or product which the country exports/imports to make your case. Lesotho Ghana Mozambiquearrow_forwardNot use ai pleasearrow_forward
- On the 1st of April 2018, the South African National Treasury increase the value-added tax rate from 14% to 15%. This policy change had a wide-ranging impact on society. Discuss some of the benefits and drawbacks of making use of this type of tax to generate government revenue and what we may expect in terms of its impact on inflation and GDP growth within the economy.arrow_forward5. We learnt the following equation in the class: Ak = sy - (n + 8)k where y = ko. Now, I transform this equation into: Ak/k = sy/k - (n + 8). I want you to use a diagram to show the steady state solution of this equation (In the diagram, there will be two curves - one represents sy/k and one represents (n + 8). In the steady state, of course, Ak/k = 0). In this diagram, the x-axis is k. What will happen to this diagram if the value of n increases?arrow_forwardNot use ai pleasearrow_forward
- 3. A country has the following production function: Y = K0.2L0.6p0.2 where Y is total output, K is capital stock, L is population size and P is land size. The depreciation rate (8) is 0.05. The population growth rate (n) is 0. We define: y = ½, k = 1 and p = . Land size is fixed. L a) Find out the steady state values of k and y in terms of p, the per capita land size.arrow_forwardNot use ai please letarrow_forwardConsider the market for sweaters in a Hamilton neighbourhood shown in the figure to the right. The consumer surplus generated by consuming the 29th sweater is OA. $67.90. OB. $58.20. ○ C. $77.60. OD. $38.80. ○ E. $19.50. Price ($) 97 68.0 48.5 29.0 29.0 Sweater Market 48.5 Quantity (Sweaters per week)arrow_forward


 Managerial Economics: Applications, Strategies an...EconomicsISBN:9781305506381Author:James R. McGuigan, R. Charles Moyer, Frederick H.deB. HarrisPublisher:Cengage Learning

