
Horngren's Cost Accounting: A Managerial Emphasis (16th Edition)
16th Edition
ISBN: 9780134475585
Author: Srikant M. Datar, Madhav V. Rajan
Publisher: PEARSON
expand_more
expand_more
format_list_bulleted
Concept explainers
Videos
Textbook Question
Chapter 14, Problem 14.27E
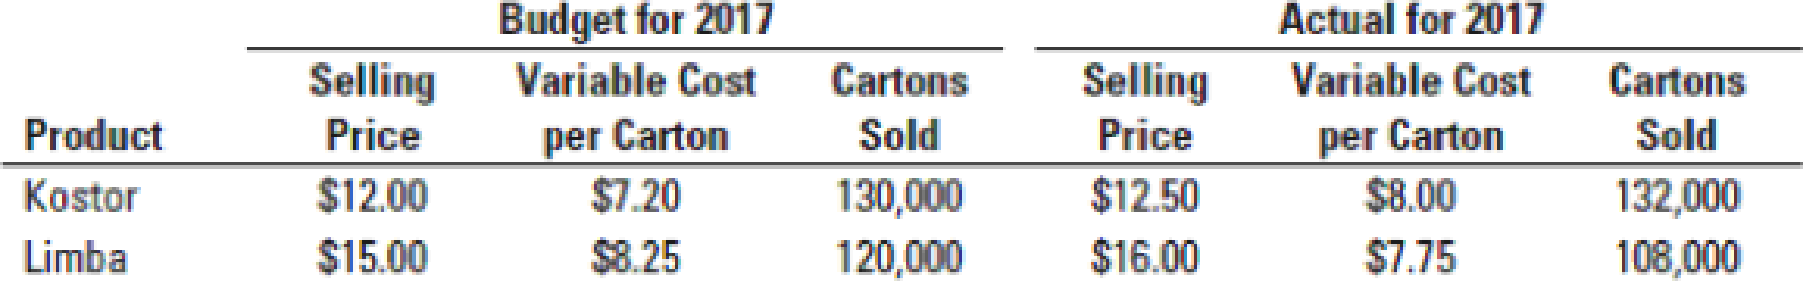
- 1. Compute the total sales-volume variance, the total sales-mix variance, and the total sales-quantity variance. (Calculate all variances in terms of contribution margin.) Show results for each product in your computations.
Required
- 2. What inferences can you draw from the variances computed in requirement 1?
Expert Solution & Answer
Want to see the full answer?
Check out a sample textbook solution
Students have asked these similar questions
Sunshine Blender Company sold 7,000 units in October at a sales price of $40 per unit. The variable cost is $25 per unit. Calculate the total contribution
margin.
OA. $280,000
OB. $105,000
OC. $87,500
OD. $175,000
I want to correct answer general accounting question
Five I
+
Beginning Work-in-Process Inventory
Cost of Goods Manufactured
Cost of Goods Sold
Direct Labor
Direct Materials Used
Ending Work-in-Process Inventory
Finished Goods Inventory
4 of 35 >
manufactured. Use the followin
Process Inventory, $32,800; an
Total Manufacturing Costs Incurred during Period
Total Manufacturing Costs to Account For
Chapter 14 Solutions
Horngren's Cost Accounting: A Managerial Emphasis (16th Edition)
Ch. 14 - Prob. 14.1QCh. 14 - Why is customer-profitability analysis an...Ch. 14 - Prob. 14.3QCh. 14 - A customer-profitability profile highlights those...Ch. 14 - Give examples of three different levels of costs...Ch. 14 - What information does the whale curve provide?Ch. 14 - A company should not allocate all of its corporate...Ch. 14 - What criteria might managers use to guide...Ch. 14 - Once a company allocates corporate costs to...Ch. 14 - A company should not allocate costs that are fixed...
Ch. 14 - How should a company decide on the number of cost...Ch. 14 - Show how managers can gain insight into the causes...Ch. 14 - How can the concept of a composite unit be used to...Ch. 14 - Explain why a favorable sales-quantity variance...Ch. 14 - How can the sales-quantity variance be decomposed...Ch. 14 - Flexible-budget variance, sales-quantity,...Ch. 14 - Sales-volume, sales-mix, and sales-quantity...Ch. 14 - Cost allocation in hospitals, alternative...Ch. 14 - Customer profitability, customer-cost hierarchy....Ch. 14 - Customer profitability, service company. Instant...Ch. 14 - Customer profitability, distribution. Best Drugs...Ch. 14 - Cost allocation and decision making. Reidland...Ch. 14 - Cost allocation to divisions. Rembrandt Hotel ...Ch. 14 - Cost allocation to divisions. Bergen Corporation...Ch. 14 - Prob. 14.25ECh. 14 - Variance analysis, working backward. The Hiro...Ch. 14 - Variance analysis, multiple products. Emcee Inc....Ch. 14 - Market-share and market-size variances...Ch. 14 - Click here to open your MyFinanceLab Study Plan...Ch. 14 - Customer profitability. Bracelet Delights is a new...Ch. 14 - Customer profitability, distribution. Green Paper...Ch. 14 - Customer profitability in a manufacturing firm....Ch. 14 - Customer-cost hierarchy, customer profitability....Ch. 14 - Allocation of corporate costs to divisions. Cathy...Ch. 14 - Cost allocation to divisions. Forber Bakery makes...Ch. 14 - Prob. 14.36PCh. 14 - Cost-hierarchy income statement and allocation of...Ch. 14 - Variance analysis, sales-mix and sales-quantity...Ch. 14 - Market-share and market-size variances...Ch. 14 - Variance analysis, multiple products. The Robins...Ch. 14 - Customer profitability and ethics. KC Corporation...
Knowledge Booster


Learn more about
Need a deep-dive on the concept behind this application? Look no further. Learn more about this topic, accounting and related others by exploring similar questions and additional content below.Similar questions
- Don't use ai given answer accounting questionsarrow_forwardRequirement 1. For a manufacturing company, identify the following as either a product cost or a period cost: Period cost Product cost a. Depreciation on plant equipment Depreciation on salespersons' automobiles Insurance on plant building Marketing manager's salary Direct materials used Manufacturing overhead g. Electricity bill for human resources office h. Production employee wagesarrow_forwardI want to correct answer general accounting questionarrow_forward
- Tungsten, Inc. manufactures both normal and premium tube lights. The company allocates manufacturing over machine hours as the allocation base. Estimated overhead costs for the year are $108,000. Additional estimated information is given below. Machine hours (MHr) Direct materials Normal 23,000 $60,000 Premium 31,000 $480,000 Calculate the predetermined overhead allocation rate. (Round your answer to the nearest cent.) OA. $4.70 per direct labor hour OB. $3.48 per machine hour OC. $2.00 per machine hour OD. $0.20 per direct labor hourarrow_forward< Factory Utilities Indirect Materials Used $1,300 34,500 Direct Materials Used 301,000 Property Taxes on Factory Building 5,100 Sales Commissions 82,000 Indirect Labor Incurred 25,000 Direct Labor Incurred 150,000 Depreciation on Factory Equipment 6,300 What is the total manufacturing overhead?arrow_forwardDiscuss the financial reporting environment and financial statements. What is the purpose of accounting? What impact does the AICPA, FASB, and SEC play in accounting, particularly with regards to the financial statements?arrow_forward
- K Sunlight Design Corporation sells glass vases at a wholesale price of $3.50 per unit. The variable cost to manufacture is $1.75 per unit. The monthly fixed costs are $7,500. Its current sales are 27,000 units per month. If the company wants to increase its operating income by 30%, how many additional units must it sell? (Round any intermediate calculations to two decimal places and your final answer up to the nearest whole unit.) A. 7,500 glass vases OB. 33,815 glass vases OC. 6,815 glass vases D. 94,500 glass vasesarrow_forwardCan you help me with of this question general accountingarrow_forwardWhat is the correct option? General accounting questionarrow_forward
arrow_back_ios
SEE MORE QUESTIONS
arrow_forward_ios
Recommended textbooks for you
 Cornerstones of Cost Management (Cornerstones Ser...AccountingISBN:9781305970663Author:Don R. Hansen, Maryanne M. MowenPublisher:Cengage Learning
 Managerial AccountingAccountingISBN:9781337912020Author:Carl Warren, Ph.d. Cma William B. TaylerPublisher:South-Western College Pub
 Financial And Managerial AccountingAccountingISBN:9781337902663Author:WARREN, Carl S.Publisher:Cengage Learning,
 Managerial Accounting: The Cornerstone of Busines...AccountingISBN:9781337115773Author:Maryanne M. Mowen, Don R. Hansen, Dan L. HeitgerPublisher:Cengage Learning
 Principles of Accounting Volume 2AccountingISBN:9781947172609Author:OpenStaxPublisher:OpenStax College
Cornerstones of Cost Management (Cornerstones Ser...
Accounting
ISBN:9781305970663
Author:Don R. Hansen, Maryanne M. Mowen
Publisher:Cengage Learning
Managerial Accounting
Accounting
ISBN:9781337912020
Author:Carl Warren, Ph.d. Cma William B. Tayler
Publisher:South-Western College Pub
Financial And Managerial Accounting
Accounting
ISBN:9781337902663
Author:WARREN, Carl S.
Publisher:Cengage Learning,
Managerial Accounting: The Cornerstone of Busines...
Accounting
ISBN:9781337115773
Author:Maryanne M. Mowen, Don R. Hansen, Dan L. Heitger
Publisher:Cengage Learning
Principles of Accounting Volume 2
Accounting
ISBN:9781947172609
Author:OpenStax
Publisher:OpenStax College
What is variance analysis?; Author: Corporate finance institute;https://www.youtube.com/watch?v=SMTa1lZu7Qw;License: Standard YouTube License, CC-BY