
Concept explainers
Videos
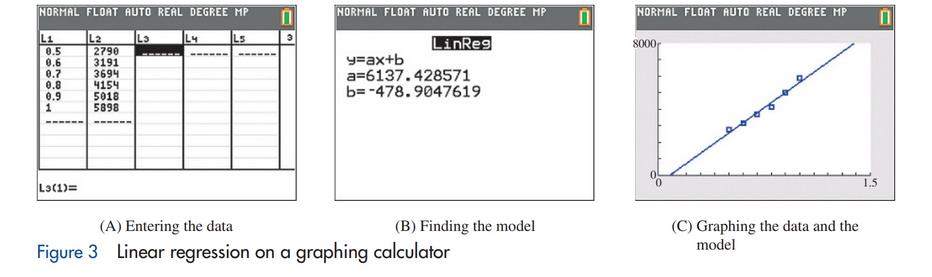
As stated previously, we used linear regression to produce the model in Example 3. If you have a graphing calculator that supports linear regression, then you can find this model. The linear regression process varies greatly from one calculator to another. Consult the user’s manual for the details of linear regression. The screens in Figure 3 are related to the construction of the model in Example 3 on a Texas Instruments TI-84 Plus CE.
(A) Produce similar screens on your graphing calculator.
(B) Do the same for Matched Problem 3.
Want to see the full answer?
Check out a sample textbook solution
Chapter 1 Solutions
Finite Mathematics for Business, Economics, Life Sciences and Social Sciences
Additional Math Textbook Solutions
Excursions in Modern Mathematics (9th Edition)
Calculus Volume 1
Calculus for Business, Economics, Life Sciences, and Social Sciences (14th Edition)
Thinking Mathematically (7th Edition)
A Survey of Mathematics with Applications (10th Edition) - Standalone book
Mathematical Ideas (13th Edition) - Standalone book


- Does Table 1 represent a linear function? If so, finda linear equation that models the data.arrow_forwardDemand for Candy Bars In this problem you will determine a linear demand equation that describes the demand for candy bars in your class. Survey your classmates to determine what price they would be willing to pay for a candy bar. Your survey form might look like the sample to the left. a Make a table of the number of respondents who answered yes at each price level. b Make a scatter plot of your data. c Find and graph the regression line y=mp+b, which gives the number of respondents y who would buy a candy bar if the price were p cents. This is the demand equation. Why is the slope m negative? d What is the p-intercept of the demand equation? What does this intercept tell you about pricing candy bars? Would you buy a candy bar from the vending machine in the hallway if the price is as indicated. Price Yes or No 50 75 1.00 1.25 1.50 1.75 2.00arrow_forwardWhat is interpolation when using a linear model?arrow_forward
- A researcher is investigating possible explanations for deaths in traffic accidents. He examined data from 2000 for each of the 52 cities randomly selected in the US. The variables were death and income. Deaths: The number of deaths in traffic accidents per cityIncome: The median income per city The researcher ran a simple linear regression model: Deaths = Bo+B1(Income). Results shown in photo below. Question: Please help me better understand how to use results from photo to find value of R-squared of this simple linear regression model.arrow_forwardMeasuring the height of a tree is usually more difficult than measuring the diameter of the tree. Therefore, many researchers use regression models to predict the height of a tree from its diameter measured at 4 feet 6 inches from the ground. The following computer output shows the results of a linear regression based on the heights, in feet, and the diameters, in inches, recorded from 31 felled trees. Which of the following statements are true about this regression model? (There is more than one statement that is true. A correct answer includes selecting ALL of the true statements.) Intercept Diameter Estimate 62.031 1.054 Std Error 4.383 0.322 t value 14.15 3.27 Pr(> |t) 0.0000 0.0028 The degrees of freedom is n - 1 = 30. The standard error of the height is 0.322. The degrees of freedom is n - 2 = 29. The slope of the regression line is 62.031. The slope of the regression line is 1.054. A 90 percent confidence interval for the slope of the population regression line is (0.396,…arrow_forwardAppendix Note: The keys to press may vary depending on the calculator model or brand that you are using. HOW TO USE THE LINEAR REGRESSION FUNCTION OF YOUR CALCULATOR (Gray Screen; Black Font) Step 1: Switch calculator ON ALL Step 2: Clear the calculator's memory: SHIFT CLR 3 REG LIN Step 3: Go to Linear Regression Mode: MODE 3 1 X1 Step 4: Encode Data: M+ X2 y2 M+ X3 y3 M+ Yn M+ II .. .. ..arrow_forward
- Imagine Daenerys Targaryen as a researcher concerned with the dragon species. The people of Westeros believed that dragons were decreasing in size due to captivity. Dragon size was normally measured as wingspan (meters) and captivity was normally measured in years. Daenerys used archival data and determined that the relationship between these two variables could be explained using the following regression equation: y-predicted = 453 - 2.5xInterpret this equation (i.e. What is its purpose? What is the intercept? What is the slope? What does it mean for dragons in Westeros?).arrow_forwardIConsider the following multiple linear regression model and the Excel print out of its regression results: Beer = Bo + BIEDUC + B2AGE + BAGE? + BAGENDER + BERACE+ BEGENDER*RACE+ E, where Beer is monthly beer consumption (ounces), EDUC is years of education. We have 2 qualitative variables: gender and race. Gender takes 2 values, GEN=1 if the person is male and GEN=0 for females. The variable race also takes 2 values, RACE=1 if the person is white and RACE=0 if the person is not white. SUMMARY OUTPUT Regression Statistics R Square Adjusted R Square Standard Error Observations ??? 0.4684 ??? 40 ANOVA df MS Regression Residual ??? 319.3 64.8 ??? ??? ??? 8.43 Total ??? 597.5 Coefficients Standard Error Intercept -150.254 107.397 EDUC -16.7755 8.4579 75.45905 -1.72456 AGE 37.3261 AGE 0.5397 GEN 238.9424 81.6054 RACE 123.7404 103.1804 GEN. RACE 76.4308 51.0670 a. Calculate the missing numbers (???). b.Interpret the parameter of RACE (123.74). c. Is the parameter of RACE (Bs) significant?…arrow_forwardWhat needs to change in an overall problem if one wants to use linear regression?arrow_forward

 Algebra and Trigonometry (MindTap Course List)AlgebraISBN:9781305071742Author:James Stewart, Lothar Redlin, Saleem WatsonPublisher:Cengage Learning
 College AlgebraAlgebraISBN:9781305115545Author:James Stewart, Lothar Redlin, Saleem WatsonPublisher:Cengage Learning
 Algebra & Trigonometry with Analytic GeometryAlgebraISBN:9781133382119Author:SwokowskiPublisher:Cengage
 Glencoe Algebra 1, Student Edition, 9780079039897...AlgebraISBN:9780079039897Author:CarterPublisher:McGraw Hill
 Trigonometry (MindTap Course List)TrigonometryISBN:9781305652224Author:Charles P. McKeague, Mark D. TurnerPublisher:Cengage Learning