![Finite Mathematics for Business, Economics, Life Sciences and Social Sciences](https://www.bartleby.com/isbn_cover_images/9780134677972/9780134677972_largeCoverImage.gif)
Concept explainers
Cigarette smoking. The data in Table 7 shows that the percentage of female cigarette smokers in the United States declined from
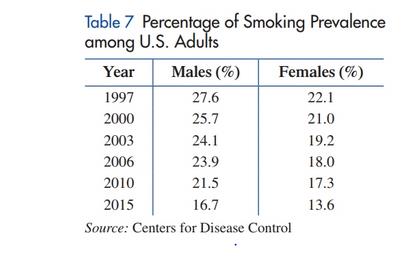
Applying linear regression to the data for females in Table 7 produces the model
where
since 1997. Draw a
model on the same axes.
(B) Estimate the first year in which the percentage of female smokers is less than
![Check Mark](/static/check-mark.png)
Want to see the full answer?
Check out a sample textbook solution![Blurred answer](/static/blurred-answer.jpg)
Chapter 1 Solutions
Finite Mathematics for Business, Economics, Life Sciences and Social Sciences
Additional Math Textbook Solutions
A Problem Solving Approach to Mathematics for Elementary School Teachers (12th Edition)
Calculus Volume 1
Probability and Statistics for Engineers and Scientists
Calculus Volume 2
Thinking Mathematically (7th Edition)
A Problem Solving Approach To Mathematics For Elementary School Teachers (13th Edition)
- Does Table 1 represent a linear function? If so, finda linear equation that models the data.arrow_forwardLife Expectancy The following table shows the average life expectancy, in years, of a child born in the given year42 Life expectancy 2005 77.6 2007 78.1 2009 78.5 2011 78.7 2013 78.8 a. Find the equation of the regression line, and explain the meaning of its slope. b. Plot the data points and the regression line. c. Explain in practical terms the meaning of the slope of the regression line. d. Based on the trend of the regression line, what do you predict as the life expectancy of a child born in 2019? e. Based on the trend of the regression line, what do you predict as the life expectancy of a child born in 1580?2300arrow_forwardWhat is regression analysis? Describe the process of performing regression analysis on a graphing utility.arrow_forward
- XYZ Corporation Stock Prices The following table shows the average stock price, in dollars, of XYZ Corporation in the given month. Month Stock price January 2011 43.71 February 2011 44.22 March 2011 44.44 April 2011 45.17 May 2011 45.97 a. Find the equation of the regression line. Round the regression coefficients to three decimal places. b. Plot the data points and the regression line. c. Explain in practical terms the meaning of the slope of the regression line. d. Based on the trend of the regression line, what do you predict the stock price to be in January 2012? January 2013?arrow_forwardDemand for Candy Bars In this problem you will determine a linear demand equation that describes the demand for candy bars in your class. Survey your classmates to determine what price they would be willing to pay for a candy bar. Your survey form might look like the sample to the left. a Make a table of the number of respondents who answered yes at each price level. b Make a scatter plot of your data. c Find and graph the regression line y=mp+b, which gives the number of respondents y who would buy a candy bar if the price were p cents. This is the demand equation. Why is the slope m negative? d What is the p-intercept of the demand equation? What does this intercept tell you about pricing candy bars? Would you buy a candy bar from the vending machine in the hallway if the price is as indicated. Price Yes or No 50 75 1.00 1.25 1.50 1.75 2.00arrow_forwardTable 2 shows a recent graduate’s credit card balance each month after graduation. a. Use exponential regression to fit a model to these data. b. If spending continues at this rate, what will the graduate’s credit card debt be one year after graduating?arrow_forward
- The U.S. Census tracks the percentage of persons 25 years or older who are college graduates. That data forseveral years is given in Table 4[14]. Determine whether the trend appears linear. If so, and assuming the trendcontinues. in what year will the percentage exceed 35%?arrow_forward1. Develop a simple linear regression equation for starting salaries using an independent variable that has the closest relationship with the salaries. Explain how you chose this variable.arrow_forwardA FIFA World Cup football is dropped from 35 different heights (in cm) and the height of the bounce is recorded (in cm.) The regression analysis gives the model bounce = -0.1 +0.70 drop. Predict the height of the bounce if dropped from 64 cm. 44.7 cm 44.8 cm 64.6 cm 91.57 cm 44.9 cmarrow_forward
- The U.S. Postal Service is attempting to reduce the number of complaints made by the public against its workers. To facilitate this task, a staff analyst for the service regresses the number of complaints lodged against an employee last year on the hourly wage of the employee for the year. The analyst ran a simple linear regression in SPSS. The results are shown below. What proportion of variation in the number of complaints can be explained by hourly wages? From the results shown above, write the regression equation If wages were increased by $1.00, what is the expected effect on the number of complaints received per employee?arrow_forwardDevelop a scatterplot and explore the correlation between customer age and net sales by each type of customer (regular/promotion). Use the horizontal axis for the customer age to graph. Find the linear regression line that models the data by each type of customer. Round the rate of changes (slopes) to two decimal places and interpret them in terms of the relation between the change in age and the change in net sales. What can you conclude? Hint: Rate of Change = Vertical Change / Horizontal Change = Change in y / Change in xarrow_forwardWhich pair of h0/h1 is used in the two sided test for the slope of a simple linear regression?arrow_forward
- Glencoe Algebra 1, Student Edition, 9780079039897...AlgebraISBN:9780079039897Author:CarterPublisher:McGraw Hill
- Functions and Change: A Modeling Approach to Coll...AlgebraISBN:9781337111348Author:Bruce Crauder, Benny Evans, Alan NoellPublisher:Cengage LearningBig Ideas Math A Bridge To Success Algebra 1: Stu...AlgebraISBN:9781680331141Author:HOUGHTON MIFFLIN HARCOURTPublisher:Houghton Mifflin HarcourtAlgebra and Trigonometry (MindTap Course List)AlgebraISBN:9781305071742Author:James Stewart, Lothar Redlin, Saleem WatsonPublisher:Cengage Learning
![Text book image](https://www.bartleby.com/isbn_cover_images/9781337282291/9781337282291_smallCoverImage.gif)
![Text book image](https://www.bartleby.com/isbn_cover_images/9781938168383/9781938168383_smallCoverImage.gif)
![Text book image](https://www.bartleby.com/isbn_cover_images/9780079039897/9780079039897_smallCoverImage.jpg)
![Text book image](https://www.bartleby.com/isbn_cover_images/9781337111348/9781337111348_smallCoverImage.gif)
![Text book image](https://www.bartleby.com/isbn_cover_images/9781680331141/9781680331141_smallCoverImage.jpg)
![Text book image](https://www.bartleby.com/isbn_cover_images/9781305071742/9781305071742_smallCoverImage.gif)