
Concept explainers
Videos
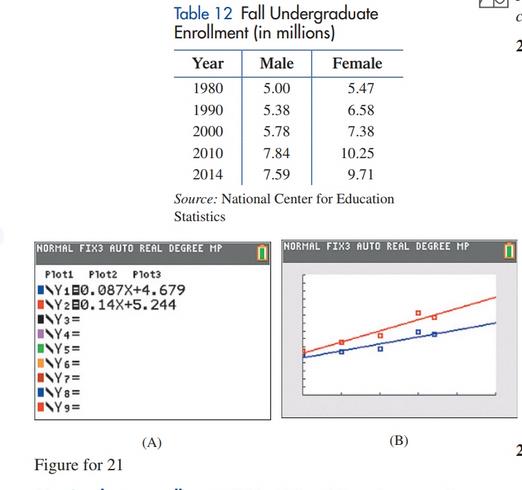
Undergraduate enrollment. Table 12 lists fall undergraduate enrollment by gender in U.S. degree-granting institutions. The figure contains a
(A) Interpret the slope of each model.
(B) Use the regression models to predict the male and female undergraduate enrollments in
2025.
(C) Use the regression models to estimate the first year in which female undergraduate
enrollment will exceed male undergraduate enrollment by at least 3 million.
Want to see the full answer?
Check out a sample textbook solution
Chapter 1 Solutions
Finite Mathematics for Business, Economics, Life Sciences and Social Sciences
Additional Math Textbook Solutions
Basic Business Statistics, Student Value Edition
Pre-Algebra Student Edition
Thinking Mathematically (6th Edition)
A Problem Solving Approach To Mathematics For Elementary School Teachers (13th Edition)
Algebra and Trigonometry (6th Edition)
Elementary Statistics (13th Edition)


- Find the slope of the tangent line to the graph of the function at the given point. m = 8 f(x) = 7x at (1,3) Determine an equation of the tangent line. y = Need Help? Read It Watch Itarrow_forwardFind the slope of the tangent line to the graph of the function at the given point. f(x) = -4x + 5 at (-1, 9) m Determine an equation of the tangent line. y = Need Help? Read It Watch It SUBMIT ANSWERarrow_forwardFind the slope of the tangent line to the graph of the function at the given point. f(x) = 5x-4x² at (-1, -9) m Determine an equation of the tangent line. y = Need Help? Read It Master It SUBMIT ANSWERarrow_forward
- y = log 5 – x2 - 4 00arrow_forwardFor what value of A and B the function f(x) will be continuous everywhere for the given definition?..arrow_forwardPlease fill in the rest of the steps of the proof of Thm 2.5. Show how "Repeating this step with n-1,n-2,...,2 in place of n" gives us the desired result.arrow_forward
- 2. [-/1 Points] DETAILS MY NOTES SESSCALCET2 6.4.006.MI. Use the Table of Integrals to evaluate the integral. (Remember to use absolute values where appropriate. Use C for the constant of integration.) 7y2 y² 11 dy Need Help? Read It Master It SUBMIT ANSWER 3. [-/1 Points] DETAILS MY NOTES SESSCALCET2 6.4.009. Use the Table of Integrals to evaluate the integral. (Remember to use absolute values where appropriate. Use C for the constant of integration.) tan³(12/z) dz Need Help? Read It Watch It SUBMIT ANSWER 4. [-/1 Points] DETAILS MY NOTES SESSCALCET2 6.4.014. Use the Table of Integrals to evaluate the integral. (Use C for the constant of integration.) 5 sinб12x dx Need Help? Read Itarrow_forwardPlease refer belowarrow_forwardy"-9y+20y= 80t-156 y(0) = −6, y'(0) = 5 y(t) =arrow_forward
 Functions and Change: A Modeling Approach to Coll...AlgebraISBN:9781337111348Author:Bruce Crauder, Benny Evans, Alan NoellPublisher:Cengage Learning
 Glencoe Algebra 1, Student Edition, 9780079039897...AlgebraISBN:9780079039897Author:CarterPublisher:McGraw Hill
 Algebra and Trigonometry (MindTap Course List)AlgebraISBN:9781305071742Author:James Stewart, Lothar Redlin, Saleem WatsonPublisher:Cengage Learning

 College AlgebraAlgebraISBN:9781305115545Author:James Stewart, Lothar Redlin, Saleem WatsonPublisher:Cengage Learning