![Finite Mathematics for Business, Economics, Life Sciences and Social Sciences](https://www.bartleby.com/isbn_cover_images/9780134677972/9780134677972_largeCoverImage.gif)
Concept explainers
Licensed drivers. Table 8 contains the state population and the number of licensed drivers in the state (both in millions) for the states with population under 1 million in 2014. The regression model for this data is
where
(A) Draw a
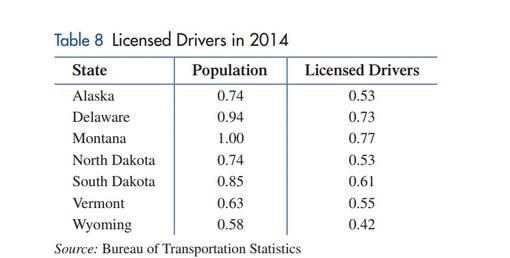
(B) If the population of Hawaii in 2014 was about 1.4 million, use the model to estimate the
number of licensed drivers in Hawaii in 2014 to the nearest thousand.
(C) If the number of licensed drivers in Maine in 2014 was about 1,019,000, use the model to
estimate the population of Maine in 2014 to the nearest thousand.
![Check Mark](/static/check-mark.png)
Want to see the full answer?
Check out a sample textbook solution![Blurred answer](/static/blurred-answer.jpg)
Chapter 1 Solutions
Finite Mathematics for Business, Economics, Life Sciences and Social Sciences
Additional Math Textbook Solutions
Mathematics for Elementary Teachers with Activities (5th Edition)
Thinking Mathematically (6th Edition)
Mathematics with Applications In the Management, Natural and Social Sciences (11th Edition)
Mathematical Ideas (13th Edition) - Standalone book
A Survey of Mathematics with Applications (10th Edition) - Standalone book
Mathematics All Around (6th Edition)
- Does Table 1 represent a linear function? If so, finda linear equation that models the data.arrow_forwardLife Expectancy The following table shows the average life expectancy, in years, of a child born in the given year42 Life expectancy 2005 77.6 2007 78.1 2009 78.5 2011 78.7 2013 78.8 a. Find the equation of the regression line, and explain the meaning of its slope. b. Plot the data points and the regression line. c. Explain in practical terms the meaning of the slope of the regression line. d. Based on the trend of the regression line, what do you predict as the life expectancy of a child born in 2019? e. Based on the trend of the regression line, what do you predict as the life expectancy of a child born in 1580?2300arrow_forwardDemand for Candy Bars In this problem you will determine a linear demand equation that describes the demand for candy bars in your class. Survey your classmates to determine what price they would be willing to pay for a candy bar. Your survey form might look like the sample to the left. a Make a table of the number of respondents who answered yes at each price level. b Make a scatter plot of your data. c Find and graph the regression line y=mp+b, which gives the number of respondents y who would buy a candy bar if the price were p cents. This is the demand equation. Why is the slope m negative? d What is the p-intercept of the demand equation? What does this intercept tell you about pricing candy bars? Would you buy a candy bar from the vending machine in the hallway if the price is as indicated. Price Yes or No 50 75 1.00 1.25 1.50 1.75 2.00arrow_forward
- XYZ Corporation Stock Prices The following table shows the average stock price, in dollars, of XYZ Corporation in the given month. Month Stock price January 2011 43.71 February 2011 44.22 March 2011 44.44 April 2011 45.17 May 2011 45.97 a. Find the equation of the regression line. Round the regression coefficients to three decimal places. b. Plot the data points and the regression line. c. Explain in practical terms the meaning of the slope of the regression line. d. Based on the trend of the regression line, what do you predict the stock price to be in January 2012? January 2013?arrow_forwardWhat is regression analysis? Describe the process of performing regression analysis on a graphing utility.arrow_forward
- College AlgebraAlgebraISBN:9781305115545Author:James Stewart, Lothar Redlin, Saleem WatsonPublisher:Cengage LearningAlgebra and Trigonometry (MindTap Course List)AlgebraISBN:9781305071742Author:James Stewart, Lothar Redlin, Saleem WatsonPublisher:Cengage LearningGlencoe Algebra 1, Student Edition, 9780079039897...AlgebraISBN:9780079039897Author:CarterPublisher:McGraw Hill
- Big Ideas Math A Bridge To Success Algebra 1: Stu...AlgebraISBN:9781680331141Author:HOUGHTON MIFFLIN HARCOURTPublisher:Houghton Mifflin HarcourtFunctions and Change: A Modeling Approach to Coll...AlgebraISBN:9781337111348Author:Bruce Crauder, Benny Evans, Alan NoellPublisher:Cengage Learning
![Text book image](https://www.bartleby.com/isbn_cover_images/9781305115545/9781305115545_smallCoverImage.gif)
![Text book image](https://www.bartleby.com/isbn_cover_images/9781305071742/9781305071742_smallCoverImage.gif)
![Text book image](https://www.bartleby.com/isbn_cover_images/9780079039897/9780079039897_smallCoverImage.jpg)
![Text book image](https://www.bartleby.com/isbn_cover_images/9781337282291/9781337282291_smallCoverImage.gif)
![Text book image](https://www.bartleby.com/isbn_cover_images/9781680331141/9781680331141_smallCoverImage.jpg)
![Text book image](https://www.bartleby.com/isbn_cover_images/9781337111348/9781337111348_smallCoverImage.gif)