
Videos
a.
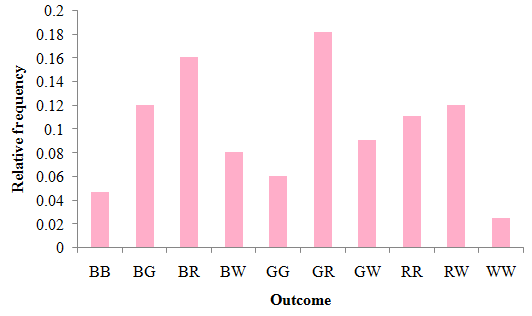
Create a frequency table and relative frequency graph of the data.
a.
Answer to Problem 14PPS

Explanation of Solution
Given information:
Tai has a sack of
Calculation:
Let use abbreviations for each color for example B for black ,
The possible
The number of ways to select
The probability of selecting
Similarly the frequency table will be,
The frequency graph will be,
b.
Find the most likely occurred outcome.
b.
Answer to Problem 14PPS
The outcome one marble green and other red is most likely occurred.
Explanation of Solution
Given information:
Tai has a sack of
Calculation:
The outcome one marble green and other red is most likely occurred.
c.
Find the
c.
Answer to Problem 14PPS
Explanation of Solution
Given information:
Tai has a sack of
Calculation:
The probability of green and black is,
Chapter 12 Solutions
Algebra 2
Additional Math Textbook Solutions
Algebra and Trigonometry (6th Edition)
A Problem Solving Approach To Mathematics For Elementary School Teachers (13th Edition)
Elementary Statistics: Picturing the World (7th Edition)
University Calculus: Early Transcendentals (4th Edition)
Introductory Statistics
Elementary Statistics (13th Edition)


- Find the Laplace Transform of the function to express it in frequency domain form.arrow_forwardPlease draw a graph that represents the system of equations f(x) = x2 + 2x + 2 and g(x) = –x2 + 2x + 4?arrow_forwardGiven the following system of equations and its graph below, what can be determined about the slopes and y-intercepts of the system of equations? 7 y 6 5 4 3 2 -6-5-4-3-2-1 1+ -2 1 2 3 4 5 6 x + 2y = 8 2x + 4y = 12 The slopes are different, and the y-intercepts are different. The slopes are different, and the y-intercepts are the same. The slopes are the same, and the y-intercepts are different. O The slopes are the same, and the y-intercepts are the same.arrow_forward
- Choose the function to match the graph. -2- 0 -7 -8 -9 --10- |--11- -12- f(x) = log x + 5 f(x) = log x - 5 f(x) = log (x+5) f(x) = log (x-5) 9 10 11 12 13 14arrow_forwardWhich of the following represents the graph of f(x)=3x-2? 7 6 5 4 ++ + + -7-6-5-4-3-2-1 1 2 3 4 5 6 7 -2 3 -5 6 -7 96 7 5 4 O++ -7-6-5-4-3-2-1 -2 -3 -4 -5 -7 765 432 -7-6-5-4-3-2-1 -2 ++ -3 -4 -5 -6 2 3 4 5 6 7 7 6 2 345 67 -7-6-5-4-3-2-1 2 3 4 5 67 4 -5arrow_forward13) Let U = {j, k, l, m, n, o, p} be the universal set. Let V = {m, o,p), W = {l,o, k}, and X = {j,k). List the elements of the following sets and the cardinal number of each set. a) W° and n(W) b) (VUW) and n((V U W)') c) VUWUX and n(V U W UX) d) vnWnX and n(V WnX)arrow_forward
- 9) Use the Venn Diagram given below to determine the number elements in each of the following sets. a) n(A). b) n(A° UBC). U B oh a k gy ท W z r e t ་ Carrow_forward10) Find n(K) given that n(T) = 7,n(KT) = 5,n(KUT) = 13.arrow_forward7) Use the Venn Diagram below to determine the sets A, B, and U. A = B = U = Blue Orange white Yellow Black Pink Purple green Grey brown Uarrow_forward
 Algebra and Trigonometry (6th Edition)AlgebraISBN:9780134463216Author:Robert F. BlitzerPublisher:PEARSON
 Contemporary Abstract AlgebraAlgebraISBN:9781305657960Author:Joseph GallianPublisher:Cengage Learning
 Linear Algebra: A Modern IntroductionAlgebraISBN:9781285463247Author:David PoolePublisher:Cengage Learning
 Algebra And Trigonometry (11th Edition)AlgebraISBN:9780135163078Author:Michael SullivanPublisher:PEARSON
 Introduction to Linear Algebra, Fifth EditionAlgebraISBN:9780980232776Author:Gilbert StrangPublisher:Wellesley-Cambridge Press
 College Algebra (Collegiate Math)AlgebraISBN:9780077836344Author:Julie Miller, Donna GerkenPublisher:McGraw-Hill Education