A Preparation of Ratios
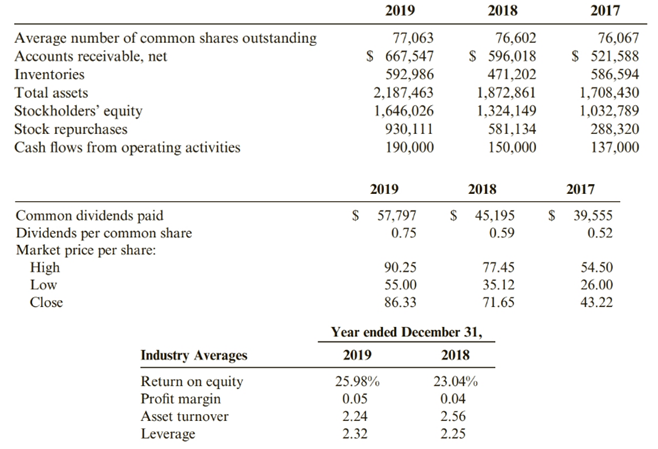
Refer to the financial statements for Burch Industries in Problem 12-89A and the following data.

Required:
1. Prepare all the financial ratios for Burch for 2019 and 2018 (using percentage terms where appropriate and rounding all answers to two decimal places).
2. CONCEPTUAL CONNECTION Explain whether Burch’s short-term liquidity is adequate.
3. CONCEPTUAL CONNECTION Discuss whether Burch uses its assets efficiently.
4. CONCEPTUAL CONNECTION Determine whether Burch is profitable.
5. CONCEPTUAL CONNECTION Discuss whether long-term creditors should regard Burch as a high-risk or a low-risk firm.
6. Perform a Dupont analysis (rounding to two decimal places) for 2018 and 2019.
(a)
An organization’s liquidity is its capacity to meet its short-term financial commitments. Liquidity proportions endeavor to quantify an organization’s capacity to satisfy its short-term obligation commitments. This is finished by contrasting an organization’s most fluid resources, those that can be effectively changed over to money, with its short-term liabilities.
To discuss:
Calculate all financial ratio.
Answer to Problem 92PSA
| Ratio | 2019 | 2018 |
| Current ratio | 3.58 | 3.30 |
| Quick ratio | 2.18 | 2.10 |
| Cash ratio | 0.64 | 0.62 |
| Operating cash flow ratio | 0.42 | 0.35 |
| Long-term debt to equity ratio | 0.01 | 0.058 |
| Debt to equity ratio | 0.35 | 0.414 |
| Long-term debt to total assets ratio | 0.007 | 0.041 |
| Debt to Total assets ratio | 0.25 | 0.30 |
| Accounts receivable turnover ratio | 6.22 | 6.09 |
| Inventory turnover ratio | 4.48 | 3.95 |
| Assets turnover ratio | 1.93 | 1.90 |
| Gross profit percentage | 0.40 | 0.386 |
| Return on assets | 0.19 | 0.19 |
| Return on equity | 0.25 | 0.279 |
| Earnings per share ratio | 4.73 | 4.30 |
| Return on common equity | 4.73 | 4.30 |
| Dividend yield ratio | 0.009 | 0.016 |
| Stock repurchase payout ratio | 2.54 | 1.765 |
Explanation of Solution
For 2019
Short-term liquidity ratios
Assets Efficiency ratios
Profitability ratio
Stockholder Ratios
For 2018
Short-term liquidity ratios
Assets Efficiency ratios
Profitability ratio
Stockholder Ratios
(b)
A company’s liquidity is its capacity to meet its short-term money related obligations. Liquidity ratios endeavor to measure a company’s capacity to satisfy its short-term obligation obligations. This is finished by looking at a company’s most fluid assets, those that can be easily changed over to cash, with its short-term liabilities.
To discuss:
Discuss the Short term liquidity.
Answer to Problem 92PSA
As per the company ratio, the company has more cash and company need to investment the extra cash in the market or any other place so company earn more benefit.
Explanation of Solution
Short-term liquidity always be better if the ratio is near about 2:1, 1:1 and like this.
In this company both the year ratio is high which better but not effective for the company its company have more cash so company need to investment the extra cash in the market.
(c)
The benefit turnover ratio is an efficiency ratio that estimates an organization’s capacity to create deals from its advantages by contrasting net deals and normal all out resources. At the end of the day, this ratio demonstrates how productively an organization can utilize its resources for create deals.
To discuss:
Discuss the assets efficiently ratio.
Answer to Problem 92PSA
Company cannot use the assets properly so the ratio is low. The company real need to improve the efficiency of assets for increase the production.
The Company have sufficient assets but company not uses the assets for production.
Explanation of Solution
Higher stock turnover ratios are viewed as a positive pointer of powerful stock administration. Nonetheless, a higher stock turnover ratio improves execution. It in some cases may show lacking stock dimension, which may result in decline in deals.
(d)
Profitability ratios are a class of money related measurements that are utilized to survey a business' capacity to produce income with respect to its income, working costs, accounting report resources, and shareholders' value after some time, utilizing information from a particular point in time.
To discuss:
Discuss the profitability of the company.
Answer to Problem 92PSA
Company have good profitability according to all profitability ratio but the company have more resource to earn income like extra utilization of assets for more production.
Explanation of Solution
The company have sufficient earning from the main business. The company have more benefit which can be use for the production. The company has to more resource of the assets for increase the production.
Right now profitability goods for the company.
(a)
Long Term Debt to Total Asset Ratio is the proportion that speaks to the money related position of the organization and the organization’s capacity to meet all its monetary prerequisites. It demonstrates the level of an organization’s assets that are financed with credits and other monetary commitments that last over a year.
To discuss:
Discuss the long-term creditor as a high risk or low risk.
Answer to Problem 92PSA
Long-term debt ratio is normal in the question because in 2019 the ratio is good but in 2018 the ratio more than 0.40. so the ratio in the 2018 is higher than normal.
Explanation of Solution
It is determined by separating total liabilities by total assets, with higher debt proportions demonstrating higher degrees of debt financing. Regardless of whether a debt proportion is great relies upon the setting inside which it is being broke down. From an unadulterated hazard point of view, lower proportions (0.4 or lower) are viewed as better debt proportions.
(e)
The Dupont analysis sometime called the Dupont display is a monetary proportion dependent on the arrival on value proportion that is utilized to investigate an organization’s capacity to build its arrival on value. As it were, this model separates the arrival on value proportion to clarify how organizations can expand their arrival for speculators.
To calculate:
Calculate the Dupont analysis for 2019 and 2018.
Answer to Problem 92PSA
According to Dupont analysis
| Particular | 2019 | 2018 |
| Return on equity | 0.245 | 0.28 |
Explanation of Solution
For 2019
For 2018
Want to see more full solutions like this?
Chapter 12 Solutions
Cornerstones of Financial Accounting
- Dakota Manufacturing had 3,120 units, one-fourth completed at the beginning of the period. 14,580 units were transferred to Department Y from Department X during the period, and 680 units were one-third completed at the end of the period. What is the total number of units to be assigned cost on the cost of production report for Department X?arrow_forwardKindly help me with accounting questionsarrow_forwardGarrison Enterprises has a net profit margin of 6%, a total asset turnover of 1.8 times, and a debt ratio of 30%. What is its return on equity? Need solutionarrow_forward
 Financial AccountingAccountingISBN:9781337272124Author:Carl Warren, James M. Reeve, Jonathan DuchacPublisher:Cengage Learning
- Century 21 Accounting Multicolumn JournalAccountingISBN:9781337679503Author:GilbertsonPublisher:Cengage
 Intermediate Financial Management (MindTap Course...FinanceISBN:9781337395083Author:Eugene F. Brigham, Phillip R. DavesPublisher:Cengage Learning


