Concept explainers
Videos
(a)
To find:The quadratic regressionfor the datagiven in the table for the gross revenue of Broadway season.
(a)
Answer to Problem 54E
The
Explanation of Solution
Given information:The table given below shows the gross revenue for Broadway season in different years:
| Broadway Season Revenue | |
| Year | Amount ($ millions) |
| 1994 | 406 |
| 1999 | 603 |
| 2004 | 769 |
| 2005 | 862 |
| 2006 | 939 |
| 2007 | 938 |
Calculation:
Consider that
To find the natural logarithm regression equation of the given data, use graphing calculator.
Step 1: Press
Step 2: List the input values 4, 9, 14, 15, 16 and 17 in the L1 column.
Step 3: List the input values 406, 603, 769, 862, 939 and 938 in the L2 column.
Step 4: Press the keystrokes
Therefore, the quadratic regression equation for the Broadway Season Revenue is
(b)
To plot:The graph of the quadratic regression for the given data on a
(b)
Explanation of Solution
Given information:The table given below shows the gross revenue for Broadway season in different years:
| Broadway Season Revenue | |
| Year | Amount ($ millions) |
| 1994 | 406 |
| 1999 | 603 |
| 2004 | 769 |
| 2005 | 862 |
| 2006 | 939 |
| 2007 | 938 |
Graph:
From part (a), the quadratic regression equation for the Broadway Season Revenue is
Step 1: Press
Step 2: Press
Step 3: Press the keystrokes
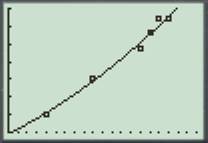
Figure (1)
Interpretation: From the graph it can be observed that the gross revenue for Broadway season in year 2008 is more than 1000 millions of dollars.
(c)
To find: The amount of gross revenue for the Broadway Season in year 2012.
(c)
Answer to Problem 54E
The amount of gross revenue for the Broadway Season in year 2012 is 1228.15 millions of dollars.
Explanation of Solution
Given information:The table given below shows the gross revenue for Broadway season in different years:
| Broadway Season Revenue | |
| Year | Amount ($ millions) |
| 1994 | 406 |
| 1999 | 603 |
| 2004 | 769 |
| 2005 | 862 |
| 2006 | 939 |
| 2007 | 938 |
Calculation:
From part (a), the quadratic regression equation for the Broadway Season Revenue is
Consider that
Substitute 22 for x in the quadratic regression equation.
Therefore, the amount of gross revenue for the Broadway Season in year 2012 is 1228.15 millions of dollars.
(d)
To find:The linear regression for the data given in the table for the gross revenue of Broadway season and the amount of revenue in 2012.
(d)
Answer to Problem 54E
The linear regression equation for the Broadway Season Revenue is
Explanation of Solution
Given information:The table given below shows the gross revenue for Broadway season in different years:
| Broadway Season Revenue | |
| Year | Amount ($ millions) |
| 1994 | 406 |
| 1999 | 603 |
| 2004 | 769 |
| 2005 | 862 |
| 2006 | 939 |
| 2007 | 938 |
Calculation:
To find the linear regression equation of the given data, use graphing calculator.
Press the keystrokes
Now, substitute 22 for x in the above equation to find the revenue in 2012.
Therefore, the linear regression equation for the Broadway Season Revenue is
Chapter 1 Solutions
Calculus: Graphical, Numerical, Algebraic
Additional Math Textbook Solutions
Thinking Mathematically (6th Edition)
Elementary Statistics (13th Edition)
Introductory Statistics
Pre-Algebra Student Edition
Elementary Statistics: Picturing the World (7th Edition)
A First Course in Probability (10th Edition)


- For each graph in Figure 16, determine whether f (1) is larger or smaller than the slope of the secant line between x = 1 and x = 1 + h for h > 0. Explain your reasoningarrow_forwardPoints z1 and z2 are shown on the graph.z1 is at (4 real,6 imaginary), z2 is at (-5 real, 2 imaginary)Part A: Identify the points in standard form and find the distance between them.Part B: Give the complex conjugate of z2 and explain how to find it geometrically.Part C: Find z2 − z1 geometrically and explain your steps.arrow_forwardA polar curve is represented by the equation r1 = 7 + 4cos θ.Part A: What type of limaçon is this curve? Justify your answer using the constants in the equation.Part B: Is the curve symmetrical to the polar axis or the line θ = pi/2 Justify your answer algebraically.Part C: What are the two main differences between the graphs of r1 = 7 + 4cos θ and r2 = 4 + 4cos θ?arrow_forward
- A curve, described by x2 + y2 + 8x = 0, has a point A at (−4, 4) on the curve.Part A: What are the polar coordinates of A? Give an exact answer.Part B: What is the polar form of the equation? What type of polar curve is this?Part C: What is the directed distance when Ø = 5pi/6 Give an exact answer.arrow_forwardNew folder 10. Find the area enclosed by the loop of the curve (1- t², t-t³)arrow_forward1. Graph and find the corresponding Cartesian equation for: t X== y = t +1 2 te(-∞, ∞) 42,369 I APR 27 F5 3 MacBook Air stv A Aa T 4 DIIarrow_forward
- Middle School GP... Echo home (1) Addition and su... Google Docs Netflix Netflix New folder 9. Find the area enclosed by x = sin²t, y = cost and the y-axis.arrow_forward2. Graph and find the corresponding Cartesian equation for: (4 cos 0,9 sin 0) θ ε [0, 2π) 42,369 I APR 27 3 MacBook Air 2 tv A Aaarrow_forward30 Page< 3. Find the equation of the tangent line for x = 1+12, y = 1-3 at t = 2 42,369 APR A 27 M . tv NA 1 TAGN 2 Aa 7 MacBook Air #8arrow_forward
 Calculus: Early TranscendentalsCalculusISBN:9781285741550Author:James StewartPublisher:Cengage Learning
 Thomas' Calculus (14th Edition)CalculusISBN:9780134438986Author:Joel R. Hass, Christopher E. Heil, Maurice D. WeirPublisher:PEARSON
 Calculus: Early Transcendentals (3rd Edition)CalculusISBN:9780134763644Author:William L. Briggs, Lyle Cochran, Bernard Gillett, Eric SchulzPublisher:PEARSON
 Calculus: Early TranscendentalsCalculusISBN:9781319050740Author:Jon Rogawski, Colin Adams, Robert FranzosaPublisher:W. H. Freeman
 Calculus: Early Transcendental FunctionsCalculusISBN:9781337552516Author:Ron Larson, Bruce H. EdwardsPublisher:Cengage Learning