Concept explainers
Videos
(a)
To find:The linear regression equation for the given data.
(a)
Answer to Problem 46E
The linear regression equation for the given data is
Explanation of Solution
Given information:The table given below shows the ages and weights of nine girls:
| Girl’s ages and weights | |
| Age (months) | Weight (pounds) |
| 19 | 22 |
| 21 | 23 |
| 24 | 25 |
| 27 | 28 |
| 29 | 31 |
| 31 | 28 |
| 34 | 32 |
| 38 | 34 |
| 43 | 39 |
Calculation:
To find the linear regression equation of the given data, use graphing calculator.
Step 1: Press
Step 2: List the input values 19, 21, 24, 27, 29, 31, 34, 38 and 43 in the L1 column.
Step 3: List the input values 22, 23, 25, 28, 31, 28, 32, 34 and 39 in the L2 column.
Step 4: Press the keystrokes
Therefore, thelinear regression equation for the given data is
(b)
To find: The slope of the regression line for the given data and describe the representation of the slope.
(b)
Answer to Problem 46E
The slope of the regression line for the given data is 0.68 and it represents the average weight in pounds per month gain in girls from 1 to 4 years old.
Explanation of Solution
Given information:The table given below shows the ages and weights of nine girls:
| Girl’s ages and weights | |
| Age (months) | Weight (pounds) |
| 19 | 22 |
| 21 | 23 |
| 24 | 25 |
| 27 | 28 |
| 29 | 31 |
| 31 | 28 |
| 34 | 32 |
| 38 | 34 |
| 43 | 39 |
Calculation:
From part (a), the linear regression equation for the given data is
It is known that slope-form of a line is
Therefore, the slope of the regression line for the given data is 0.68 and it represents the average weight in pounds per month gain in girls from 1 to 4 years old.
(c)
To plot: The graph of the linear regression equation on a
(c)
Explanation of Solution
Given information:The table given below shows the ages and weights of nine girls:
| Girl’s ages and weights | |
| Age (months) | Weight (pounds) |
| 19 | 22 |
| 21 | 23 |
| 24 | 25 |
| 27 | 28 |
| 29 | 31 |
| 31 | 28 |
| 34 | 32 |
| 38 | 34 |
| 43 | 39 |
Graph:
To make the scatter plot enter the data, then follow the stepsusing graphing calculator.
Step 1: Press
Step 2: Press
Step 3: Press the keystrokes
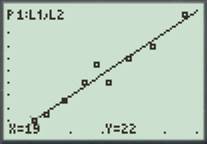
Figure (1)
Interpretation:From the graph it can be interpreted that the weight of girls is increasing as there is increasing.
(d)
To find: The weight of 30 month old girl by using the regression equation.
(d)
Answer to Problem 46E
The approximate weight of 30 month old girl is 29.4 pounds.
Explanation of Solution
Given information:The table given below shows the ages and weights of nine girls:
| Girl’s ages and weights | |
| Age (months) | Weight (pounds) |
| 19 | 22 |
| 21 | 23 |
| 24 | 25 |
| 27 | 28 |
| 29 | 31 |
| 31 | 28 |
| 34 | 32 |
| 38 | 34 |
| 43 | 39 |
Calculation:
From part (a), the linear regression equation for the given data is
To find the weight of 30 month old girl, substitute 30 for
Therefore, the approximate weight of 30 month old girl is 29.4 pounds.
Chapter 1 Solutions
Calculus: Graphical, Numerical, Algebraic
Additional Math Textbook Solutions
Calculus: Early Transcendentals (2nd Edition)
Elementary Statistics
Elementary Statistics: Picturing the World (7th Edition)
A Problem Solving Approach To Mathematics For Elementary School Teachers (13th Edition)
Thinking Mathematically (6th Edition)
College Algebra (7th Edition)


- Hello, I would like step by step solution on this practive problem please and thanks!arrow_forwardHello! Please Solve this Practice Problem Step by Step thanks!arrow_forwarduestion 10 of 12 A Your answer is incorrect. L 0/1 E This problem concerns hybrid cars such as the Toyota Prius that are powered by a gas-engine, electric-motor combination, but can also function in Electric-Vehicle (EV) only mode. The figure below shows the velocity, v, of a 2010 Prius Plug-in Hybrid Prototype operating in normal hybrid mode and EV-only mode, respectively, while accelerating from a stoplight. 1 80 (mph) Normal hybrid- 40 EV-only t (sec) 5 15 25 Assume two identical cars, one running in normal hybrid mode and one running in EV-only mode, accelerate together in a straight path from a stoplight. Approximately how far apart are the cars after 15 seconds? Round your answer to the nearest integer. The cars are 1 feet apart after 15 seconds. Q Search M 34 mlp CHarrow_forward
- Find the volume of the region under the surface z = xy² and above the area bounded by x = y² and x-2y= 8. Round your answer to four decimal places.arrow_forwardУ Suppose that f(x, y) = · at which {(x, y) | 0≤ x ≤ 2,-x≤ y ≤√x}. 1+x D Q Then the double integral of f(x, y) over D is || | f(x, y)dxdy = | Round your answer to four decimal places.arrow_forwardD The region D above can be describe in two ways. 1. If we visualize the region having "top" and "bottom" boundaries, express each as functions of and provide the interval of x-values that covers the entire region. "top" boundary 92(x) = | "bottom" boundary 91(x) = interval of values that covers the region = 2. If we visualize the region having "right" and "left" boundaries, express each as functions of y and provide the interval of y-values that covers the entire region. "right" boundary f2(y) = | "left" boundary fi(y) =| interval of y values that covers the region =arrow_forward
- Find the volume of the region under the surface z = corners (0,0,0), (2,0,0) and (0,5, 0). Round your answer to one decimal place. 5x5 and above the triangle in the xy-plane witharrow_forwardGiven y = 4x and y = x² +3, describe the region for Type I and Type II. Type I 8. y + 2 -24 -1 1 2 2.5 X Type II N 1.5- x 1- 0.5 -0.5 -1 1 m y -2> 3 10arrow_forwardGiven D = {(x, y) | O≤x≤2, ½ ≤y≤1 } and f(x, y) = xy then evaluate f(x, y)d using the Type II technique. 1.2 1.0 0.8 y 0.6 0.4 0.2 0- -0.2 0 0.5 1 1.5 2 X X This plot is an example of the function over region D. The region identified in your problem will be slightly different. y upper integration limit Integral Valuearrow_forward
- This way the ratio test was done in this conflicts what I learned which makes it difficult for me to follow. I was taught with the limit as n approaches infinity for (an+1)/(an) = L I need to find the interval of convergence for the series tan-1(x2). (The question has a table of Maclaurin series which I followed as well) https://www.bartleby.com/solution-answer/chapter-92-problem-7e-advanced-placement-calculus-graphical-numerical-algebraic-sixth-edition-high-school-binding-copyright-2020-6th-edition/9781418300203/2c1feea0-c562-4cd3-82af-bef147eadaf9arrow_forwardSuppose that f(x, y) = y√√r³ +1 on the domain D = {(x, y) | 0 ≤y≤x≤ 1}. D Then the double integral of f(x, y) over D is [ ], f(x, y)dzdy =[ Round your answer to four decimal places.arrow_forwardConsider the function f(x) = 2x² - 8x + 3 over the interval 0 ≤ x ≤ 9. Complete the following steps to find the global (absolute) extrema on the interval. Answer exactly. Separate multiple answers with a comma. a. Find the derivative of f (x) = 2x² - 8x+3 f'(x) b. Find any critical point(s) c within the intervl 0 < x < 9. (Enter as reduced fraction as needed) c. Evaluate the function at the critical point(s). (Enter as reduced fraction as needed. Enter DNE if none of the critical points are inside the interval) f(c) d. Evaluate the function at the endpoints of the interval 0 ≤ x ≤ 9. f(0) f(9) e. Based on the above results, find the global extrema on the interval and where they occur. The global maximum value is at a The global minimum value is at xarrow_forward
 Calculus: Early TranscendentalsCalculusISBN:9781285741550Author:James StewartPublisher:Cengage Learning
 Thomas' Calculus (14th Edition)CalculusISBN:9780134438986Author:Joel R. Hass, Christopher E. Heil, Maurice D. WeirPublisher:PEARSON
 Calculus: Early Transcendentals (3rd Edition)CalculusISBN:9780134763644Author:William L. Briggs, Lyle Cochran, Bernard Gillett, Eric SchulzPublisher:PEARSON
 Calculus: Early TranscendentalsCalculusISBN:9781319050740Author:Jon Rogawski, Colin Adams, Robert FranzosaPublisher:W. H. Freeman
 Calculus: Early Transcendental FunctionsCalculusISBN:9781337552516Author:Ron Larson, Bruce H. EdwardsPublisher:Cengage Learning