Concept explainers
Videos
(a)
To find:The linear regression equation for the given data.
(a)
Answer to Problem 45E
The linear regression equation for the given data is
Explanation of Solution
Given information:The table given below the mean annual compensation of construction workers for different years:
| Construction Workers’ Average Annual Compensation | |
| Year | Annual Total Compensation (dollars) |
| 1999 | 42,598 |
| 2000 | 44,764 |
| 2001 | 47,822 |
| 2002 | 48,966 |
Calculation:
To find the linear regression equation of the given data, use graphing calculator.
Step 1: Press
Step 2: List the input values 1999, 2000, 2001 and 2002 in the L1 column.
Step 3: List the input values 42598, 44764, 47822 and 48966 in the L2 column.
Step 4: Press the keystrokes
Therefore, thelinear regression equation for the given data is
(b)
To find: The slope of the regression line for the given data and describe the representation of the slope.
(b)
Answer to Problem 45E
The slope of the regression line for the given data is 2216.2 and it represents the increasing rate in earning rate of workers in dollars per year.
Explanation of Solution
Given information:The table given below the mean annual compensation of construction workers for different years:
| Construction Workers’ Average Annual Compensation | |
| Year | Annual Total Compensation (dollars) |
| 1999 | 42,598 |
| 2000 | 44,764 |
| 2001 | 47,822 |
| 2002 | 48,966 |
Calculation:
From part (a), the linear regression equation for the given data is
It is known that slope-form of a line is
Therefore, the slope of the regression line for the given data is 2216.2 and it represents the increasing rate in earning rate of workers in dollars per year.
(c)
To plot: The graph of the linear regression equation on a
(c)
Explanation of Solution
Given information:The table given below the mean annual compensation of construction workers for different years:
| Construction Workers’ Average Annual Compensation | |
| Year | Annual Total Compensation (dollars) |
| 1999 | 42,598 |
| 2000 | 44,764 |
| 2001 | 47,822 |
| 2002 | 48,966 |
Graph:
From part (a), the linear regression equation for the given data is
Now, to make the scatter plot, follow the steps using graphing calculator.
Step 1: Press
Step 2: Press
Step 3: Press the keystrokes
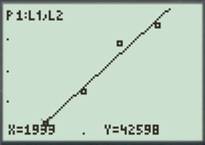
Figure (1)
Interpretation:From the graph it can be interpreted that the Annual Total Compensation in dollars of construction worker in year 2003 will be about 51578 dollars.
(d)
To find: The annual average compensation of construction workers in the year 2008 by using the regression equation.
(d)
Answer to Problem 45E
The annual average compensation of construction workers in the year 2008 is $62,659.
Explanation of Solution
Given information:The table given below the mean annual compensation of construction workers for different years:
| Construction Workers’ Average Annual Compensation | |
| Year | Annual Total Compensation (dollars) |
| 1999 | 42,598 |
| 2000 | 44,764 |
| 2001 | 47,822 |
| 2002 | 48,966 |
Calculation:
From part (a), the linear regression equation for the given data is
To find the annual average compensation, substitute 2008 for
Therefore, the annual average compensation of construction workers in the year 2008 is $62,659.
Chapter 1 Solutions
Calculus: Graphical, Numerical, Algebraic
Additional Math Textbook Solutions
Pre-Algebra Student Edition
A First Course in Probability (10th Edition)
Basic Business Statistics, Student Value Edition
Thinking Mathematically (6th Edition)
Elementary Statistics: Picturing the World (7th Edition)


- Points z1 and z2 are shown on the graph.z1 is at (4 real,6 imaginary), z2 is at (-5 real, 2 imaginary)Part A: Identify the points in standard form and find the distance between them.Part B: Give the complex conjugate of z2 and explain how to find it geometrically.Part C: Find z2 − z1 geometrically and explain your steps.arrow_forwardA polar curve is represented by the equation r1 = 7 + 4cos θ.Part A: What type of limaçon is this curve? Justify your answer using the constants in the equation.Part B: Is the curve symmetrical to the polar axis or the line θ = pi/2 Justify your answer algebraically.Part C: What are the two main differences between the graphs of r1 = 7 + 4cos θ and r2 = 4 + 4cos θ?arrow_forwardA curve, described by x2 + y2 + 8x = 0, has a point A at (−4, 4) on the curve.Part A: What are the polar coordinates of A? Give an exact answer.Part B: What is the polar form of the equation? What type of polar curve is this?Part C: What is the directed distance when Ø = 5pi/6 Give an exact answer.arrow_forward
- New folder 10. Find the area enclosed by the loop of the curve (1- t², t-t³)arrow_forward1. Graph and find the corresponding Cartesian equation for: t X== y = t +1 2 te(-∞, ∞) 42,369 I APR 27 F5 3 MacBook Air stv A Aa T 4 DIIarrow_forwardMiddle School GP... Echo home (1) Addition and su... Google Docs Netflix Netflix New folder 9. Find the area enclosed by x = sin²t, y = cost and the y-axis.arrow_forward
- 2. Graph and find the corresponding Cartesian equation for: (4 cos 0,9 sin 0) θ ε [0, 2π) 42,369 I APR 27 3 MacBook Air 2 tv A Aaarrow_forward30 Page< 3. Find the equation of the tangent line for x = 1+12, y = 1-3 at t = 2 42,369 APR A 27 M . tv NA 1 TAGN 2 Aa 7 MacBook Air #8arrow_forwardEvaluate the following integrals as they are writtenarrow_forward
- Calculus lll May I please have the blank lines completed, and final statement defined as a result? Thank you for the support!arrow_forward3. Consider the polynomial equation 6-iz+7z² - iz³ +z = 0 for which the roots are 3i, -2i, -i, and i. (a) Verify the relations between this roots and the coefficients of the polynomial. (b) Find the annulus region in which the roots lie.arrow_forwardForce with 800 N and 400 N are acting on a machine part at 30° and 60°, respectively with the positive x axisarrow_forward
 Calculus: Early TranscendentalsCalculusISBN:9781285741550Author:James StewartPublisher:Cengage Learning
 Thomas' Calculus (14th Edition)CalculusISBN:9780134438986Author:Joel R. Hass, Christopher E. Heil, Maurice D. WeirPublisher:PEARSON
 Calculus: Early Transcendentals (3rd Edition)CalculusISBN:9780134763644Author:William L. Briggs, Lyle Cochran, Bernard Gillett, Eric SchulzPublisher:PEARSON
 Calculus: Early TranscendentalsCalculusISBN:9781319050740Author:Jon Rogawski, Colin Adams, Robert FranzosaPublisher:W. H. Freeman
 Calculus: Early Transcendental FunctionsCalculusISBN:9781337552516Author:Ron Larson, Bruce H. EdwardsPublisher:Cengage Learning