
Concept explainers
Videos
a.
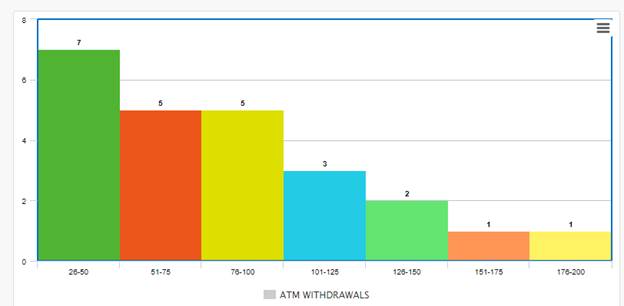
To draw: A histogram of given data using seven intervals beginning with
a.
Explanation of Solution
Given Information: A table showing the last
Histogram:
Drawing the axes and a bar to represent the frequency of each interval,
b.
To describe: Measures of center and variation representing the data best.
b.
Answer to Problem 9E
Median and five-number-summary respectively.
Explanation of Solution
Given Information: A table showing the last
As the distribution is skewed right, the best measure of center is median and best measure for variation is five-number summary. This is because the particular orientation of the concerned data.
c.
To interpret: The data when bank charges a fee for any ATM withdrawal less than
c.
Explanation of Solution
Given Information: A table showing the last
As can be observed from the histograms, most of the data lies on left side i.e. in below
Chapter 11 Solutions
Big Ideas Math A Bridge To Success Algebra 1: Student Edition 2015


- Use the graph of the polynomial function of degree 5 to identify zeros and multiplicity. Order your zeros from least to greatest. -6 3 6+ 5 4 3 2 1 2 -1 -2 -3 -4 -5 3 4 6 Zero at with multiplicity Zero at with multiplicity Zero at with multiplicityarrow_forwardUse the graph to identify zeros and multiplicity. Order your zeros from least to greatest. 6 5 4 -6-5-4-3-2 3 21 2 1 2 4 5 ૪ 345 Zero at with multiplicity Zero at with multiplicity Zero at with multiplicity Zero at with multiplicity པ་arrow_forwardUse the graph to write the formula for a polynomial function of least degree. -5 + 4 3 ♡ 2 12 1 f(x) -1 -1 f(x) 2 3. + -3 12 -5+ + xarrow_forward
- Use the graph to identify zeros and multiplicity. Order your zeros from least to greatest. 6 -6-5-4-3-2-1 -1 -2 3 -4 4 5 6 a Zero at with multiplicity Zero at with multiplicity Zero at with multiplicity Zero at with multiplicityarrow_forwardUse the graph to write the formula for a polynomial function of least degree. 5 4 3 -5 -x 1 f(x) -5 -4 -1 1 2 3 4 -1 -2 -3 -4 -5 f(x) =arrow_forwardWrite the equation for the graphed function. -8 ง -6-5 + 5 4 3 2 1 -3 -2 -1 -1 -2 4 5 6 6 -8- f(x) 7 8arrow_forward
- Write the equation for the graphed function. 8+ 7 -8 ง A -6-5 + 6 5 4 3 -2 -1 2 1 -1 3 2 3 + -2 -3 -4 -5 16 -7 -8+ f(x) = ST 0 7 8arrow_forwardThe following is the graph of the function f. 48- 44 40 36 32 28 24 20 16 12 8 4 -4 -3 -1 -4 -8 -12 -16 -20 -24 -28 -32 -36 -40 -44 -48+ Estimate the intervals where f is increasing or decreasing. Increasing: Decreasing: Estimate the point at which the graph of ƒ has a local maximum or a local minimum. Local maximum: Local minimum:arrow_forwardFor the following exercise, find the domain and range of the function below using interval notation. 10+ 9 8 7 6 5 4 3 2 1 10 -9 -8 -7 -6 -5 -4 -3 -2 -1 2 34 5 6 7 8 9 10 -1 -2 Domain: Range: -4 -5 -6 -7- 67% 9 -8 -9 -10-arrow_forward
- 1. Given that h(t) = -5t + 3 t². A tangent line H to the function h(t) passes through the point (-7, B). a. Determine the value of ẞ. b. Derive an expression to represent the gradient of the tangent line H that is passing through the point (-7. B). c. Hence, derive the straight-line equation of the tangent line H 2. The function p(q) has factors of (q − 3) (2q + 5) (q) for the interval -3≤ q≤ 4. a. Derive an expression for the function p(q). b. Determine the stationary point(s) of the function p(q) c. Classify the stationary point(s) from part b. above. d. Identify the local maximum of the function p(q). e. Identify the global minimum for the function p(q). 3. Given that m(q) = -3e-24-169 +9 (-39-7)(-In (30-755 a. State all the possible rules that should be used to differentiate the function m(q). Next to the rule that has been stated, write the expression(s) of the function m(q) for which that rule will be applied. b. Determine the derivative of m(q)arrow_forwardSafari File Edit View History Bookmarks Window Help Ο Ω OV O mA 0 mW ర Fri Apr 4 1 222 tv A F9 F10 DII 4 F6 F7 F8 7 29 8 00 W E R T Y U S D பட 9 O G H J K E F11 + 11 F12 O P } [arrow_forwardSo confused. Step by step instructions pleasearrow_forward
 Algebra and Trigonometry (6th Edition)AlgebraISBN:9780134463216Author:Robert F. BlitzerPublisher:PEARSON
 Contemporary Abstract AlgebraAlgebraISBN:9781305657960Author:Joseph GallianPublisher:Cengage Learning
 Linear Algebra: A Modern IntroductionAlgebraISBN:9781285463247Author:David PoolePublisher:Cengage Learning
 Algebra And Trigonometry (11th Edition)AlgebraISBN:9780135163078Author:Michael SullivanPublisher:PEARSON
 Introduction to Linear Algebra, Fifth EditionAlgebraISBN:9780980232776Author:Gilbert StrangPublisher:Wellesley-Cambridge Press
 College Algebra (Collegiate Math)AlgebraISBN:9780077836344Author:Julie Miller, Donna GerkenPublisher:McGraw-Hill Education