
Concept explainers
Videos
a.
To draw: A histogram of given data using seven intervals beginning with
a.
Explanation of Solution
Given Information: Table showing waiting times at a restaurant is given.
Histogram:
Drawing the axes and a bar to represent the frequency of each interval,
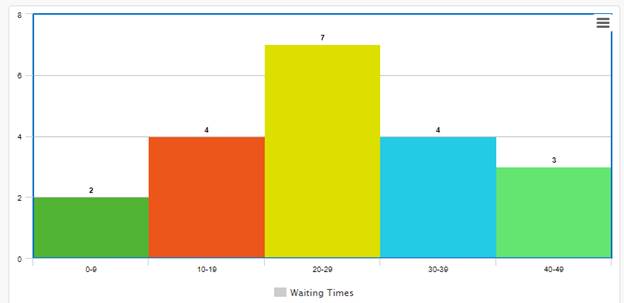
Distribution is neither skewed left nor right. Data on right is approximately mirror image of data on the left. Therefore, the distribution is symmetric.
b.
To draw: A histogram using
b.
Explanation of Solution
Given Information: Table showing waiting times at a restaurant is given.
Drawing the axes and a bar to represent the frequency of each interval,
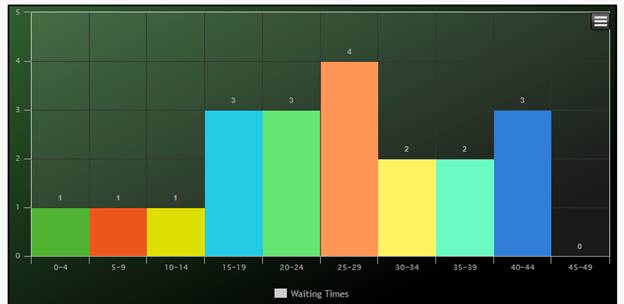
Most of the data lies at right side and the ‘tail’ extends to the left, the distribution is skewed left.
c.
To interpret: Histogram representing the data best.
c.
Explanation of Solution
Given Information: Table showing waiting times at a restaurant is given.
The histogram from part
Chapter 11 Solutions
Big Ideas Math A Bridge To Success Algebra 1: Student Edition 2015


- In simplest terms, Sketch the graph of the parabola. Then, determine its equation. opens downward, vertex is (- 4, 7), passes through point (0, - 39)arrow_forwardIn simplest way, For each quadratic relation, find the zeros and the maximum or minimum. a) y = x 2 + 16 x + 39 b) y = 5 x2 - 50 x - 120arrow_forwardIn simplest terms and step by step Write each quadratic relation in standard form, then fi nd the zeros. y = - 4( x + 6)2 + 36arrow_forward
- In simplest terms and step by step For each quadratic relation, find the zeros and the maximum or minimum. 1) y = - 2 x2 - 28 x + 64 2) y = 6 x2 + 36 x - 42arrow_forwardWrite each relation in standard form a)y = 5(x + 10)2 + 7 b)y = 9(x - 8)2 - 4arrow_forwardIn simplest form and step by step Write the quadratic relation in standard form, then fi nd the zeros. y = 3(x - 1)2 - 147arrow_forward
- Step by step instructions The path of a soccer ball can be modelled by the relation h = - 0.1 d 2 + 0.5 d + 0.6, where h is the ball’s height and d is the horizontal distance from the kicker. a) Find the zeros of the relation.arrow_forwardIn simplest terms and step by step how do you find the zeros of y = 6x2 + 24x - 192arrow_forwardStep by step Find the zeros of each quadratic relation. a) y = x2 - 16xarrow_forward
- In simplest step by step terms, how do you find the zeros of y = x2 - 16arrow_forwardIn simplest terms, Describe the shape and position of the parabola relative to the graph of y = x 2 y = - 80( x + 9) 2 + 10.8arrow_forwardas a Identify each equation Parabola, circle, ellipse perbola without completio the square. x²-6x-14 y = 33-y² 14y ofarrow_forward
 Algebra and Trigonometry (6th Edition)AlgebraISBN:9780134463216Author:Robert F. BlitzerPublisher:PEARSON
 Contemporary Abstract AlgebraAlgebraISBN:9781305657960Author:Joseph GallianPublisher:Cengage Learning
 Linear Algebra: A Modern IntroductionAlgebraISBN:9781285463247Author:David PoolePublisher:Cengage Learning
 Algebra And Trigonometry (11th Edition)AlgebraISBN:9780135163078Author:Michael SullivanPublisher:PEARSON
 Introduction to Linear Algebra, Fifth EditionAlgebraISBN:9780980232776Author:Gilbert StrangPublisher:Wellesley-Cambridge Press
 College Algebra (Collegiate Math)AlgebraISBN:9780077836344Author:Julie Miller, Donna GerkenPublisher:McGraw-Hill Education