
Concept explainers
Videos
(a)
To find: The relative frequency table showing the theoretical probabilities.
(a)
Answer to Problem 5CYU
Therelative frequency table is shown in table 1
Explanation of Solution
Given:
The given figure is shown in Figure 1
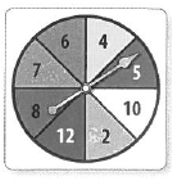
Figure 1
Calculation:
Consider the random variable is X that represents the sum of the values of two spins of the spinning wheels.
The minimum value of the wheel is 2 and maximum is 12, the X can take any value 4 to 24. Thus, the even space of the random variable is,
Consider the definition of the theatrical probability as,
The random variable can take any value of 4 in one ways as 2 in spin 1 and 2 in spin 2.
The wheel spun the number that can appear are
And,
Hence,
Similarly the random variable X can take the value 6 in two ways as,
| 1st spin | 2 | 4 |
| 2nd spin | 4 | 2 |
Then, the probability is,
Similarly the random variable X can take the value 12 in two ways as,
| 1st spin | 2 | 5 | 4 | 8 | 6 | 10 | 2 |
| 2nd spin | 5 | 2 | 8 | 4 | 6 | 2 | 10 |
Then, the probability is,
Similarly the random variable X can take the value 20 in two ways as,
| 1st spin | 10 | 12 | 8 |
| 2nd spin | 10 | 8 | 12 |
Then, the probability is,
Thus, the relative frequency table is shown in Table 1
Table 1
| Frequency | ||
| 4 | 1 | |
| 6 | 2 | |
| 7 | 2 | |
| 8 | 3 |
(b)
To find: The graph for the theoretical probability distribution.
(b)
Answer to Problem 5CYU
Thegraph is shown in Figure 1
Explanation of Solution
Calculation:
From the theoretical data shown in Table 1 the graph for the data is shown in Figure 2
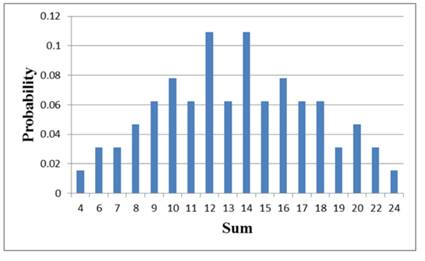
Figure 2
(c)
To find: The relative frequency table for 100 trials.
(c)
Answer to Problem 5CYU
The relative frequency table is shown in table 2
Explanation of Solution
Perform 100 trials of the spinning the wheel two times and record the sum of the values and its frequency. The calculate the corresponding probability using the same concept as mentioned in part (a)
The required table is shown in Table 2
Table 2
| Frequency | ||
| 4 | 1 | |
| 6 | 1 | |
| 7 | 3 | |
| 8 | 3 | |
| 9 | 2 | |
| 10 | 6 | |
| 11 | 5 | |
| 12 | 7 | |
| 13 | 5 | |
| 14 | 3 | |
| 15 | 3 | |
| 16 | 3 | |
| 17 | 4 | |
| 18 | 5 | |
| 19 | 2 | |
| 20 | 3 | |
| 22 | 2 | |
| 24 | 1 |
(d)
To find: The relative frequency table showing the theoretical probabilities.
(d)
Answer to Problem 5CYU
The relative frequency table is shown in table 1
Explanation of Solution
From the theoretical data shown in Table 1 the graph for the data is shown in Figure 3
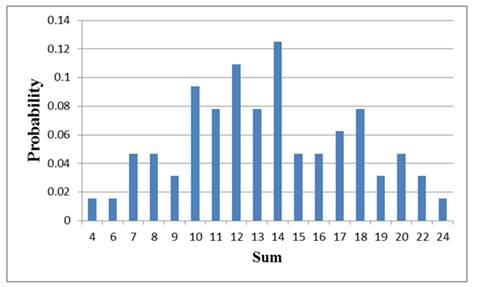
Figure 3
(e)
To find: The expected value of the random variable X .
(e)
Answer to Problem 5CYU
Thevalue of the random variable is
Explanation of Solution
Consider the formula to determine the expected value of the random variable is,
Then,
(f)
To find: The standard deviation of the random variable X.
(f)
Answer to Problem 5CYU
The value of the standard deviation is
Explanation of Solution
Consider the formula to determine standard deviation of the random variable X is,
Therefore,
Chapter 11 Solutions
Glencoe Algebra 2 Student Edition C2014
Additional Math Textbook Solutions
A First Course in Probability (10th Edition)
Pre-Algebra Student Edition
Elementary Statistics (13th Edition)
Introductory Statistics
University Calculus: Early Transcendentals (4th Edition)


- Solve questions by Course Name (Ordinary Differential Equations II 2)arrow_forwardplease Solve questions by Course Name( Ordinary Differential Equations II 2)arrow_forwardInThe Northern Lights are bright flashes of colored light between 50 and 200 miles above Earth. Suppose a flash occurs 150 miles above Earth. What is the measure of arc BD, the portion of Earth from which the flash is visible? (Earth’s radius is approximately 4000 miles.)arrow_forward
- e). n! (n - 1)!arrow_forwardSuppose you flip a fair two-sided coin four times and record the result. a). List the sample space of this experiment. That is, list all possible outcomes that could occur when flipping a fair two-sided coin four total times. Assume the two sides of the coin are Heads (H) and Tails (T).arrow_forwarde). n! (n - 1)!arrow_forward
- Evaluate the following expression and show your work to support your calculations. a). 6! b). 4! 3!0! 7! c). 5!2! d). 5!2! e). n! (n - 1)!arrow_forwardAmy and Samiha have a hat that contains two playing cards, one ace and one king. They are playing a game where they randomly pick a card out of the hat four times, with replacement. Amy thinks that the probability of getting exactly two aces in four picks is equal to the probability of not getting exactly two aces in four picks. Samiha disagrees. She thinks that the probability of not getting exactly two aces is greater. The sample space of possible outcomes is listed below. A represents an ace, and K represents a king. Who is correct?arrow_forwardConsider the exponential function f(x) = 12x. Complete the sentences about the key features of the graph. The domain is all real numbers. The range is y> 0. The equation of the asymptote is y = 0 The y-intercept is 1arrow_forward
- The graph shows Alex's distance from home after biking for x hours. What is the average rate of change from -1 to 1 for the function? 4-2 о A. -2 О B. 2 О C. 1 O D. -1 ty 6 4 2 2 0 X 2 4arrow_forwardWrite 7. √49 using rational exponents. ○ A. 57 47 B. 7 O C. 47 ○ D. 74arrow_forwardCan you check If my short explantions make sense because I want to make sure that I describe this part accuratelyarrow_forward
 Algebra and Trigonometry (6th Edition)AlgebraISBN:9780134463216Author:Robert F. BlitzerPublisher:PEARSON
 Contemporary Abstract AlgebraAlgebraISBN:9781305657960Author:Joseph GallianPublisher:Cengage Learning
 Linear Algebra: A Modern IntroductionAlgebraISBN:9781285463247Author:David PoolePublisher:Cengage Learning
 Algebra And Trigonometry (11th Edition)AlgebraISBN:9780135163078Author:Michael SullivanPublisher:PEARSON
 Introduction to Linear Algebra, Fifth EditionAlgebraISBN:9780980232776Author:Gilbert StrangPublisher:Wellesley-Cambridge Press
 College Algebra (Collegiate Math)AlgebraISBN:9780077836344Author:Julie Miller, Donna GerkenPublisher:McGraw-Hill Education